perfSonar, BWCTL and iperf
Setup Perfsonar
Installing perfSonar will take some time. Therefore we have given you a virtual machine preinstalled from here. Before starting your vm make sure you switch off all other vm's and GNS and remember to have a one perfsonar per group.
Next in your Virtual Box,
- Select the perfSonar VM and click Settings. Go to Network. In adapter 1 Select Bridged Adapter in the Attached to: drop down list. and Select the correct network interface (Which you are using). Click Ok.
- Now start the VM and Log in as root password is <Class Password>.
- Once you log in it will ask you to create a user for web administration. Give the username as admin. Give the password as <Class Password>.
- Then it will ask whether you want to disable root ssh log in and create an ssh user. hit enter. Give your name as the username. Give password as <Class Password>.
- Give the following Command. and find out your network interface name
ifconfig
- You will get something like this. Which tells that your interface name is enp0s3
enp0s3: flags=4163<UP,BROADCAST,RUNNING,MULTICAST>  mtu 1500
        inet6 fe80::a00:27ff:fe06:dbb5  prefixlen 64  scopeid 0x20<link>
        ether 08:00:27:06:db:b5  txqueuelen 10000  (Ethernet)
        RX packets 48606  bytes 5307960 (5.0 MiB)
        RX errors 0  dropped 0  overruns 0  frame 0
        TX packets 17461  bytes 1943813 (1.8 MiB)
        TX errors 0  dropped 0 overruns 0  carrier 0  collisions 0
- Now edit the /etc/sysconfig/network-scripts/ifcfg-<Your interface name> and add the following lines. You can find your group perfsonar IPv4 and IPv6 Addresses from the table
IPADDR=<Your IP Address>
GATEWAY=192.248.7.254
NETMASK=255.255.255.0
DNS1=192.248.7.254
IPV6ADDR=<Your IPv6 Address>
IPV6_DEFAULTGW=2401:dd00:2009::ffff
- Find the following line
BOOTPROTO="dhcp"
and change it to
BOOTPROTO="static"
- Restart network service
systemctl stop NetworkManager
systemctl disable NetworkManager
systemctl restart network
Now you can access the web interface
Web interface
- Open a web browser in your host pc and give the IP address of you perfsonar VM. You will get the perfsonar toolkit.
- Log in to the toolkit by by clicking the log in button. Give username as admin and password as <Class Password>
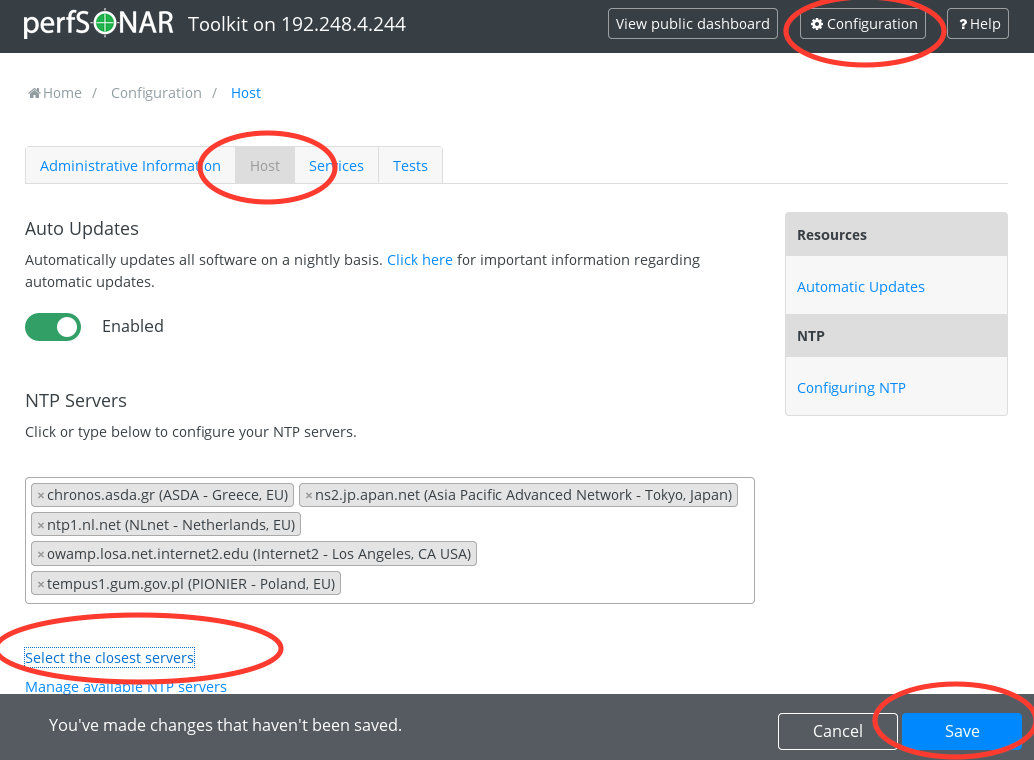
- Let set up the NTP. To do that, Click Configure button and Click the Host. Click the Select the closest servers and it will show you some closest servers. Click Save.
- Then Let's configure server details. Click the Administrative Information. Fill the following details. and Click Save
-- Organization Name : LEARN
-- City : Peradeniya
-- Country : Sri Lanka
-- State/Province : Kandy
-- !ZIP/Postal Code : 22000
-- Administrator Name : <your Name>
-- Administrator Email : <Your E mail>
-- Node Role : NREN
-- Node Access Policy : Private
-- Communities : LEARN
Testing with Perfsonar
Lets do a ping test with perfsonar.
- First Click Configure and click Test tab.
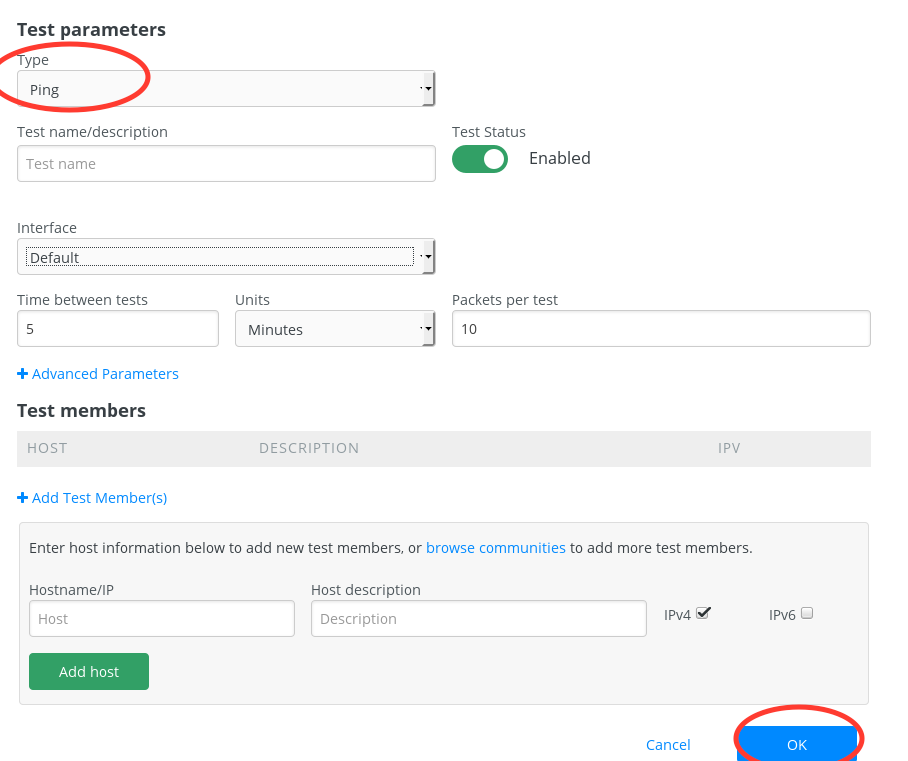
- Then Click +Test button and you will get the Test parameters page .
- Select ping from Type drop down list.
- Set the following details
- Test name/description : Test with <Neighbor group IP>
- Interface : Default
- Time between tests : 5
- Units : minutes
- Packets per test : 10
- Hostname/IP : <Your Neighbor group's IP Address>
- Host description : <Neighbor's Name>
- Click Ok
- Click Save
- You will the created test now appears in dashboard. Check for the values.
bwctl
bwctl is a command line client application that is used to initiate throughput tests. Let's measure throughput between your perfsonar node and your neighbors perfsonar node.
- ssh in to your perfsonar node. Use your name (which you give when you set up perfsonar) and <class password>
- Give the following Command
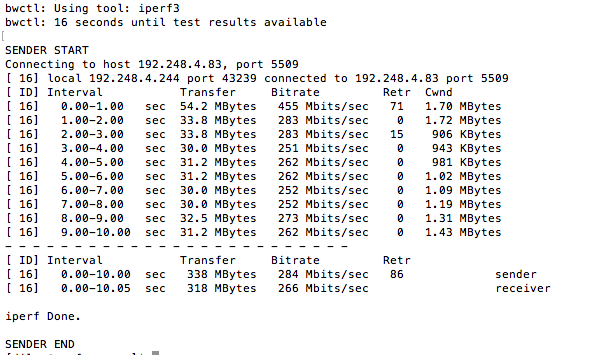
bwctl -f m -t 10 -i 1 -c <your neighbors perfsonar IP address>
- You will get an output as follows
- Check the values in Bitrate
iperf
Linux systems administrators and network administrators often find diagnosing network speed degradation complicated, as there are very few tools available to diagnose these issues. iperf is a command-line tool used in the diagnostics of network speed issues. iperf measures the maximum network throughput a server can handle. It is particularly useful when experiencing network speed issues, as you can use iperf to determine which server is unable to reach maximum throughput.
Installation
You can use apt-get to install iperf on Debian and Ubuntu:
apt-get install iperf
Note: Installation of perfsonar gives you iperf3 by default. Therefore you do not have to install iperf.
How to Use iperf
iperf must be installed on both computers between which you are testing the connection. If you are using a Unix or Linux-based operating system on your personal computer, you may be able to install iperf on your local machine. If you are testing the throughput of your Linode, however, it’s better to use another server as the end point, as your local ISP may impose network restrictions that can affect the results of your test.
TCP Clients & Servers
iperf requires two systems because one system must act as a server, while the other acts as a client. The client connects to the server you’re testing the speed of.
- On the Linode you wish to test, launch iperf3 in server mode:
iperf -s
You should see output similar to:
------------------------------------------------------------
Server listening on TCP port 5001
TCP window size:  128 KByte (default)
------------------------------------------------------------
- On your second Linode, connect to the first. Replace 192.168.1.1 with the first Linode’s IP address.
iperf -c 192.168.1.1
The output should be similar to:
------------------------------------------------------------
Client connecting to 192.168.1.1, TCP port 5001
TCP window size: 85.0 KByte (default)
------------------------------------------------------------
[  3] local 192.168.1.2 port 45448 connected with 192.168.1.1 port 5001
[ ID] Interval       Transfer     Bandwidth
[  3]  0.0-10.0 sec   524 MBytes   439 Mbits/sec
You will also see the connection and results on your iperf server. This will look similar to:
------------------------------------------------------------
Server listening on TCP port 5001
TCP window size:  128 KByte (default)
------------------------------------------------------------
[  4] local 192.168.1.1 port 5001 connected with 192.168.1.2 port 45448
[ ID] Interval       Transfer     Bandwidth
[  4]  0.0-10.1 sec   524 MBytes   437 Mbits/sec
- To stop the iperf server process, press CTRL + c.
UDP Clients & Servers
Using iPerf, you can also test the maximum throughput achieved via UDP connections.
- Start a UDP iperf server:
iperf -s -u
The output will be similar to:
------------------------------------------------------------
Server listening on TCP port 5001
Receiving 1470 byte datagrams
UDP buffer size:  192 KByte (default)
------------------------------------------------------------
- -u Connect your client to your iperf UDP server. Replace 192.168.1.1 with your IP address:
iperf -c 198.168.1.1 -u
The -u option we’ve passed tells iperf3 that we are connecting via UDP. This is important, because we want to see the maximum throughput achieved via UDP. The output should be similar to:
------------------------------------------------------------
Client connecting to 192.168.1.1, UDP port 5001
Sending 1470 byte datagrams
UDP buffer size:  208 KByte (default)
------------------------------------------------------------
[  3] local 192.168.1.2 port 35650 connected with 192.168.1.1 port 5001
[ ID] Interval       Transfer     Bandwidth
[  3]  0.0-10.0 sec  1.25 MBytes  1.05 Mbits/sec
[  3] Sent 893 datagrams
[  3] Server Report:
[  3]  0.0-10.0 sec  1.25 MBytes  1.05 Mbits/sec   0.408 ms    0/  893 (0%)
- Looking at the output we have received, 1.05 Mbits/sec is considerably less than what we received on the TCP tests. It is also considerably less than the maximum outbound bandwidth cap provided by the 1GB Linode. This is because iperf limits the bandwidth for UDP clients to 1 Mbit per second by default.
You can change this with the -b flag, replacing the number after with the maximum bandwidth rate you wish to test against. If you are testing for network speed, we recommend setting this number above the maximum bandwidth cap provided by Linode. For example, this test was run on a 1GB Linode:
iperf -c 192.168.1.1 -u -b 100m
This tells the client that we want to achieve a maximum of 100 Mbits per second if possible.
------------------------------------------------------------
Client connecting to 192.168.1.1, UDP port 5001
Sending 1470 byte datagrams
UDP buffer size:  208 KByte (default)
------------------------------------------------------------
[  3] local 192.168.1.29 port 57998 connected with 192.168.1.1 port 5001
[ ID] Interval       Transfer     Bandwidth
[  3]  0.0-10.0 sec   120 MBytes   101 Mbits/sec
[  3] Sent 85471 datagrams
[  3] Server Report:
[  3]  0.0-10.0 sec   120 MBytes   101 Mbits/sec   0.147 ms    1/85470 (0.0012%)
[  3]  0.0-10.0 sec  1 datagrams received out-of-order
Now that is considerably better than the 1.05 Mbits/sec we were seeing earlier!
Bidirectional Tests
In some cases, you may want to test both servers for the maximum amount of throughput. This can easily be done using the built-in bidirectional testing feature iperf offers.
Run the following command to test both connections:
iperf -c 192.168.1.1 -d
The result is that iperf will start a server and a client connection on the original client server (192.168.1.2). Once this has been done, iPerf will connect the original iperf server to the client connection, which is now acting as both a server connection and a client connection. This will look similar
------------------------------------------------------------
Server listening on TCP port 5001
TCP window size: 85.3 KByte (default)
------------------------------------------------------------
------------------------------------------------------------
Client connecting to 192.168.1.1, TCP port 5001
TCP window size:  170 KByte (default)
------------------------------------------------------------
[  5] local 192.168.1.2 port 45544 connected with 192.168.1.1 port 5001
[  4] local 192.168.1.2 port 5001 connected with 192.168.1.1 port 50048
[ ID] Interval       Transfer     Bandwidth
[  5]  0.0-10.0 sec   304 MBytes   255 Mbits/sec
[  4]  0.0-10.0 sec   236 MBytes   197 Mbits/sec
On the original iPerf server, you will see:
------------------------------------------------------------
Client connecting to 192.168.1.2, TCP port 5001
TCP window size:  129 KByte (default)
------------------------------------------------------------
[  6] local 192.168.1.1 port 50048 connected with 192.168.1.2 port 5001
Waiting for server threads to complete. Interrupt again to force quit.
[ ID] Interval       Transfer     Bandwidth
[  6]  0.0-10.0 sec   236 MBytes   198 Mbits/sec
[  4]  0.0-10.1 sec   304 MBytes   253 Mbits/sec


