| Version 6 (modified by , 4 years ago) ( diff ) |
|---|
Discovering perfSONAR Web Interface
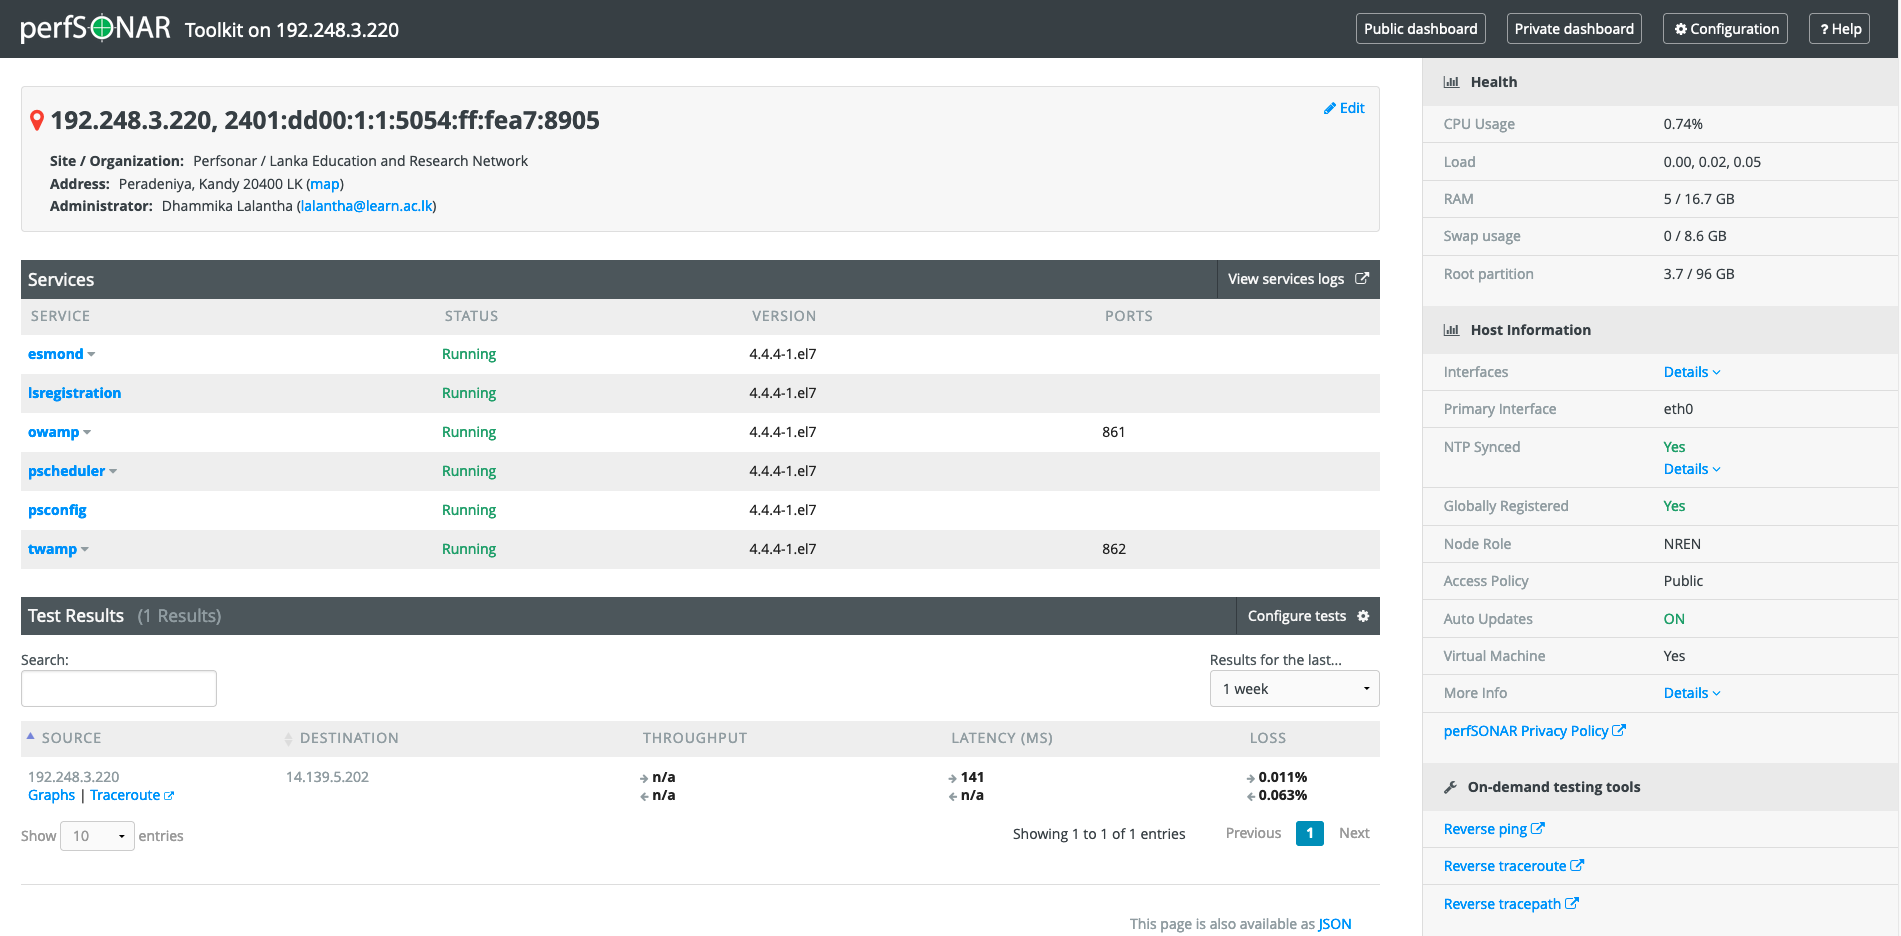
Once you login the perfSONAR web using https://[IP/Hostname]/toolkit you will see the below page.
On the toolkit dashboard there will sections for displaying different information. On the top will be node information like the IP address, Owner, Address and the administrator information.
On the right side there will be detailed host information such as Hardware profile, NTP status, Registration status, Access policy etc.
On the middle there will be a list of perfsonar services running and there will be another section at the bottom to show the Test results of the perfSONAR measurements tests.
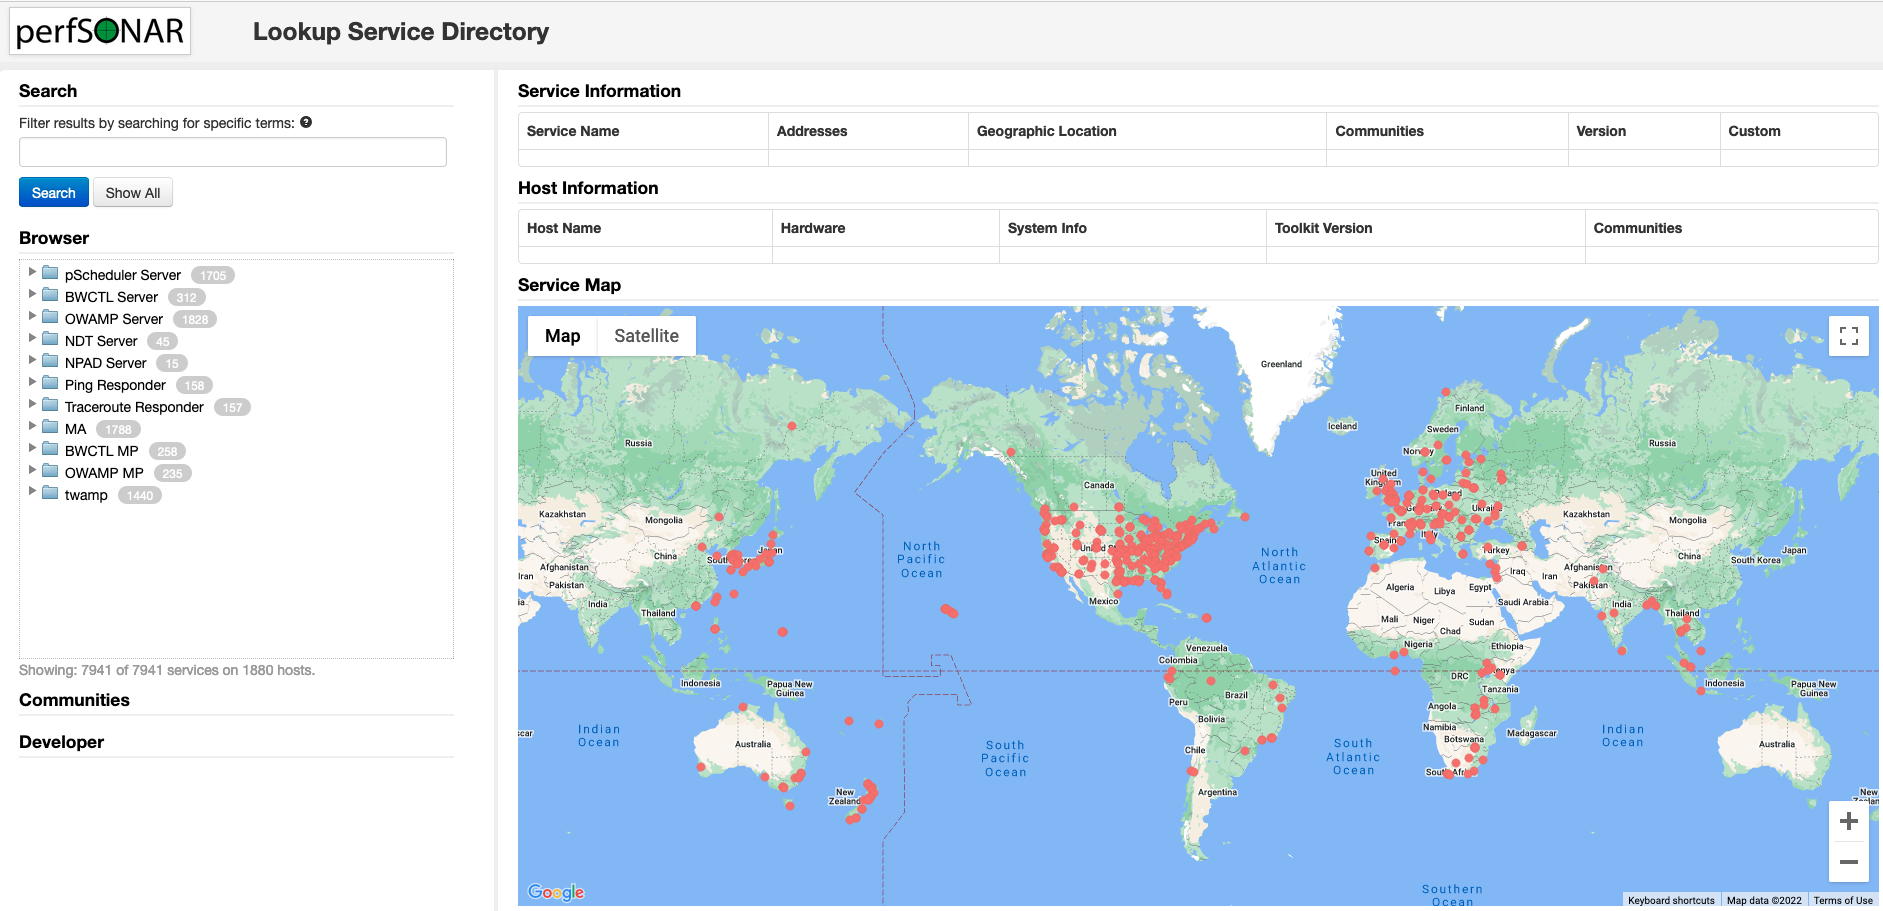
To conduct performance tests you will need at least another perfsonar node to test with. There are hundreds of perfsonar nodes installed world wide. You can find a node from any location you need by accessing this directory.
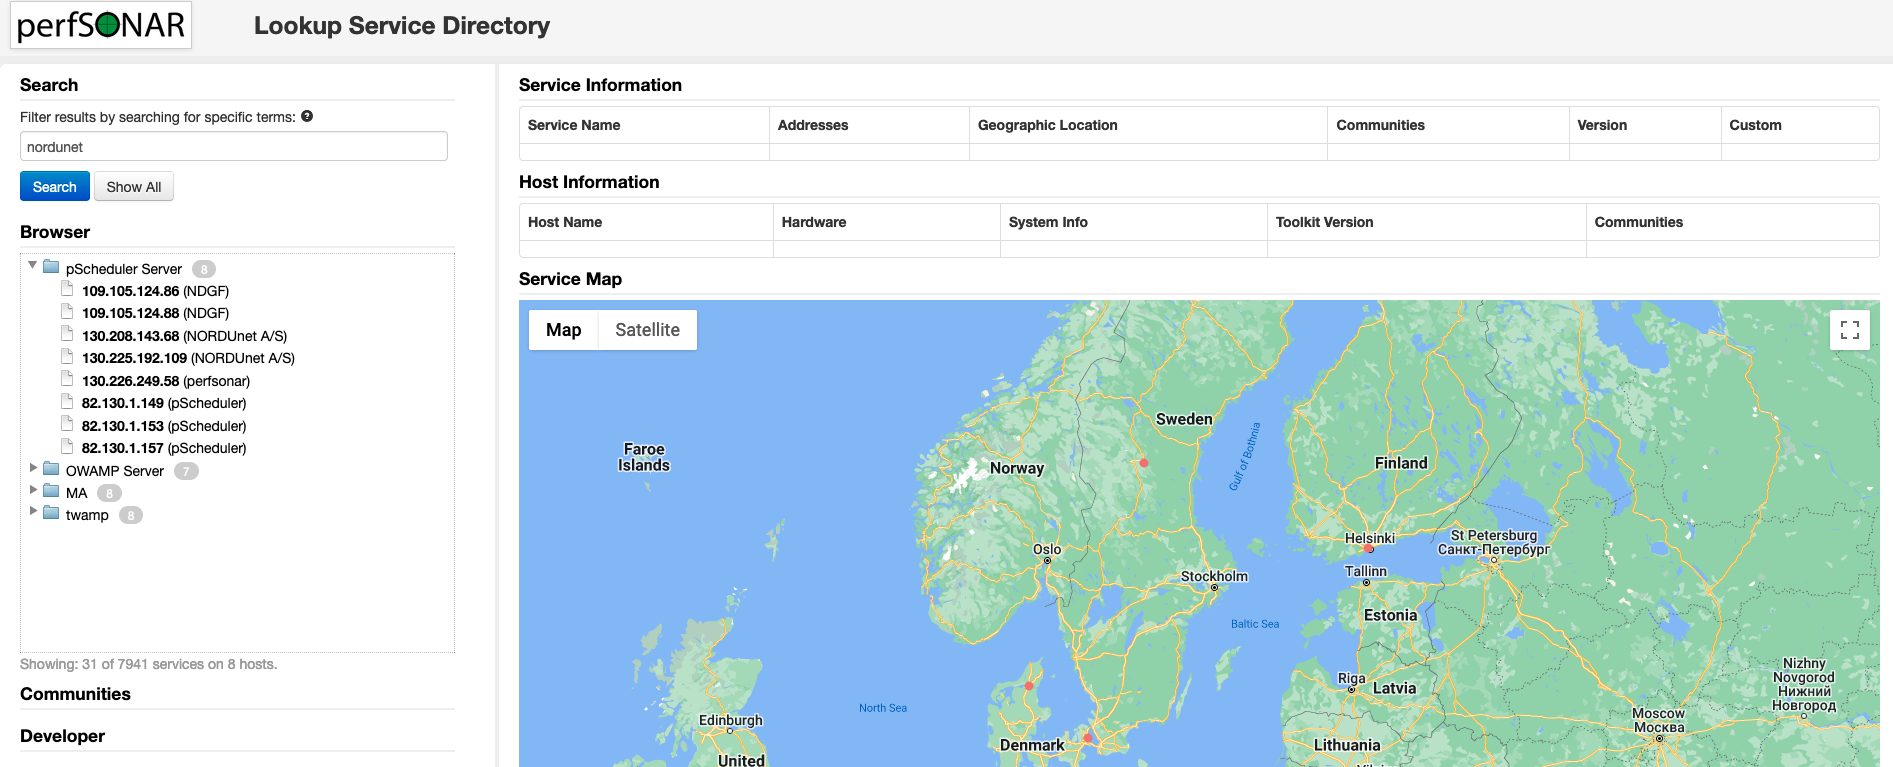
You can search the directory with any keyword, and here we will search for a node hosted by NORDUnet.
Conducting Regular Tests
A core function of the perfSONAR Toolkit is to run regularly scheduled network measurements. You can define the tests you want run through the toolkit’s web interface. There are four test types you can schedule and run through the web interface. They are One-Way Latency (Ping), Throughput, Round Trip Latency (Ping) and Traceroute tests.
One-Way Ping Test
Here we are going to schedule a test for testing One-way ping. For that we need a OWAMP service. In the OWAMP directory we can find a suitable perfSONAR node. Here we will select the highlighted node.
Now we will schedule a test and for that we need to first login to the perfSONAR. Click on Login at the top of the page.
Next click on Configuration.
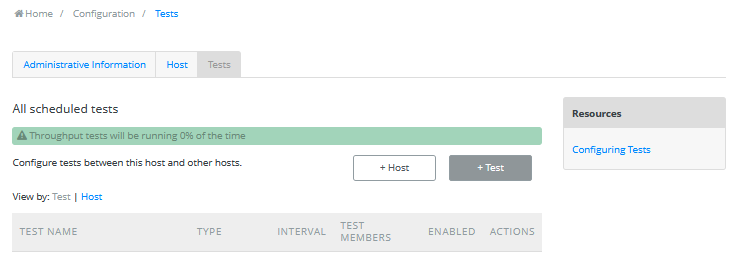
Then go to Tests tab and click on +Test to add new test.
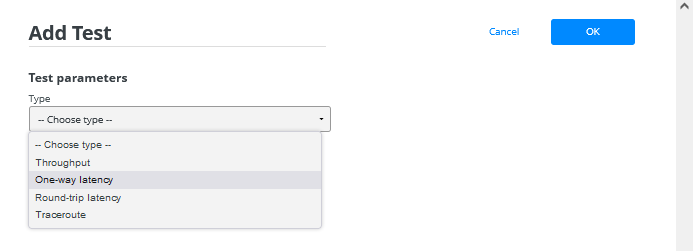
Next we have to choose the type of the test we need to add. In our case it is One-way latency.
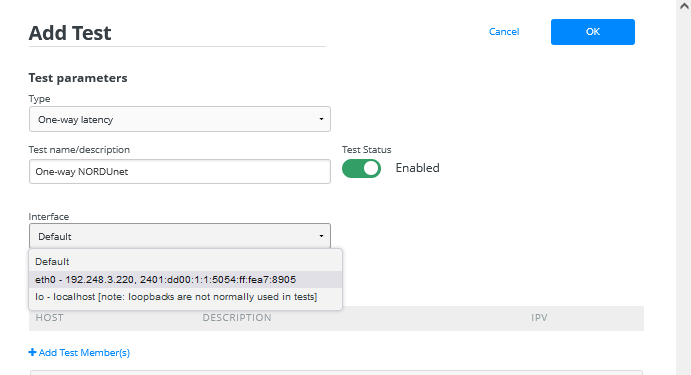
In the next field we have to choose the interface used for the test.
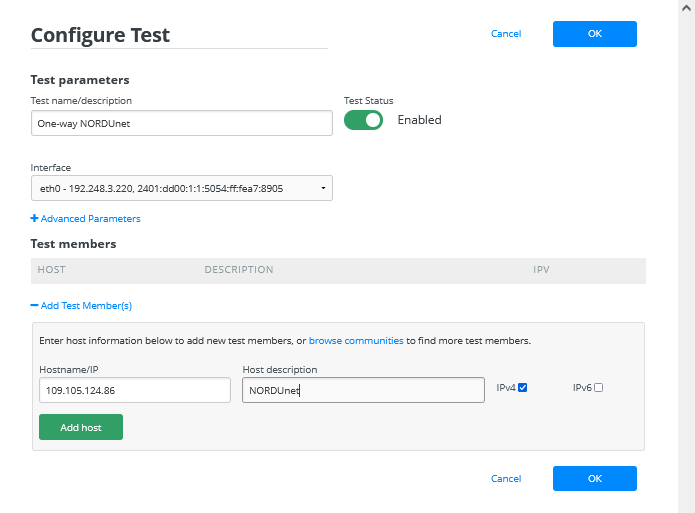
Then we will add the host or node we need to run the test with. We will enter the details of node we earlier searched for.
Once entered click OK. Next you will have to save the test created.
Now the test should run and after few minutes we can see the results by visiting the dashboard.
Throughput Test
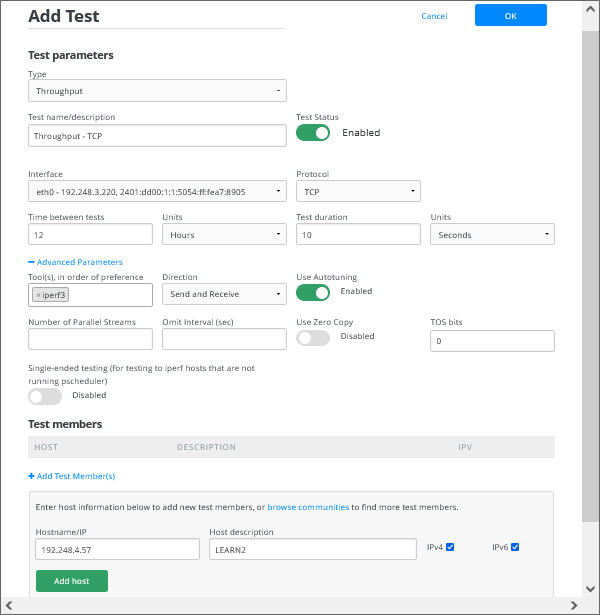
In the same way a we configured One-Way Latency test we will configure the Throughput test here. Below shows the whole configuration of the test.
Throughput Test
In the same way a we configured One-Way Latency test we will configure the Throughput test here. Below shows the whole configuration of the test.
Attachments (28)
- ps8.png (213.1 KB ) - added by 4 years ago.
- ps9.png (476.8 KB ) - added by 4 years ago.
- ps10.png (555.4 KB ) - added by 4 years ago.
- ps12.png (39.8 KB ) - added by 4 years ago.
- ps13.png (43.5 KB ) - added by 4 years ago.
- ps15.png (7.7 KB ) - added by 4 years ago.
- ps16.png (14.8 KB ) - added by 4 years ago.
- ps17.png (17.4 KB ) - added by 4 years ago.
- ps18.png (15.0 KB ) - added by 4 years ago.
- ps14.png (13.6 KB ) - added by 4 years ago.
- ps19.png (32.4 KB ) - added by 4 years ago.
- ps20.png (41.3 KB ) - added by 4 years ago.
- ps21.png (31.2 KB ) - added by 4 years ago.
- ps22.png (7.4 KB ) - added by 4 years ago.
- ps24.png (60.5 KB ) - added by 4 years ago.
- ps25.png (63.9 KB ) - added by 4 years ago.
- ps26.png (38.8 KB ) - added by 4 years ago.
- ps27.png (73.8 KB ) - added by 4 years ago.
- ps28.png (44.6 KB ) - added by 4 years ago.
- ps29.png (13.9 KB ) - added by 4 years ago.
- ps30.png (10.8 KB ) - added by 4 years ago.
- ps31.png (3.0 KB ) - added by 4 years ago.
- ps32.png (21.4 KB ) - added by 4 years ago.
- ps33.png (49.7 KB ) - added by 4 years ago.
- ps34.png (21.2 KB ) - added by 4 years ago.
- ps35.png (30.1 KB ) - added by 4 years ago.
- ps36.png (19.1 KB ) - added by 4 years ago.
- ps37.png (64.4 KB ) - added by 4 years ago.
Download all attachments as: .zip

