
Discovering perfSONAR Web Interface
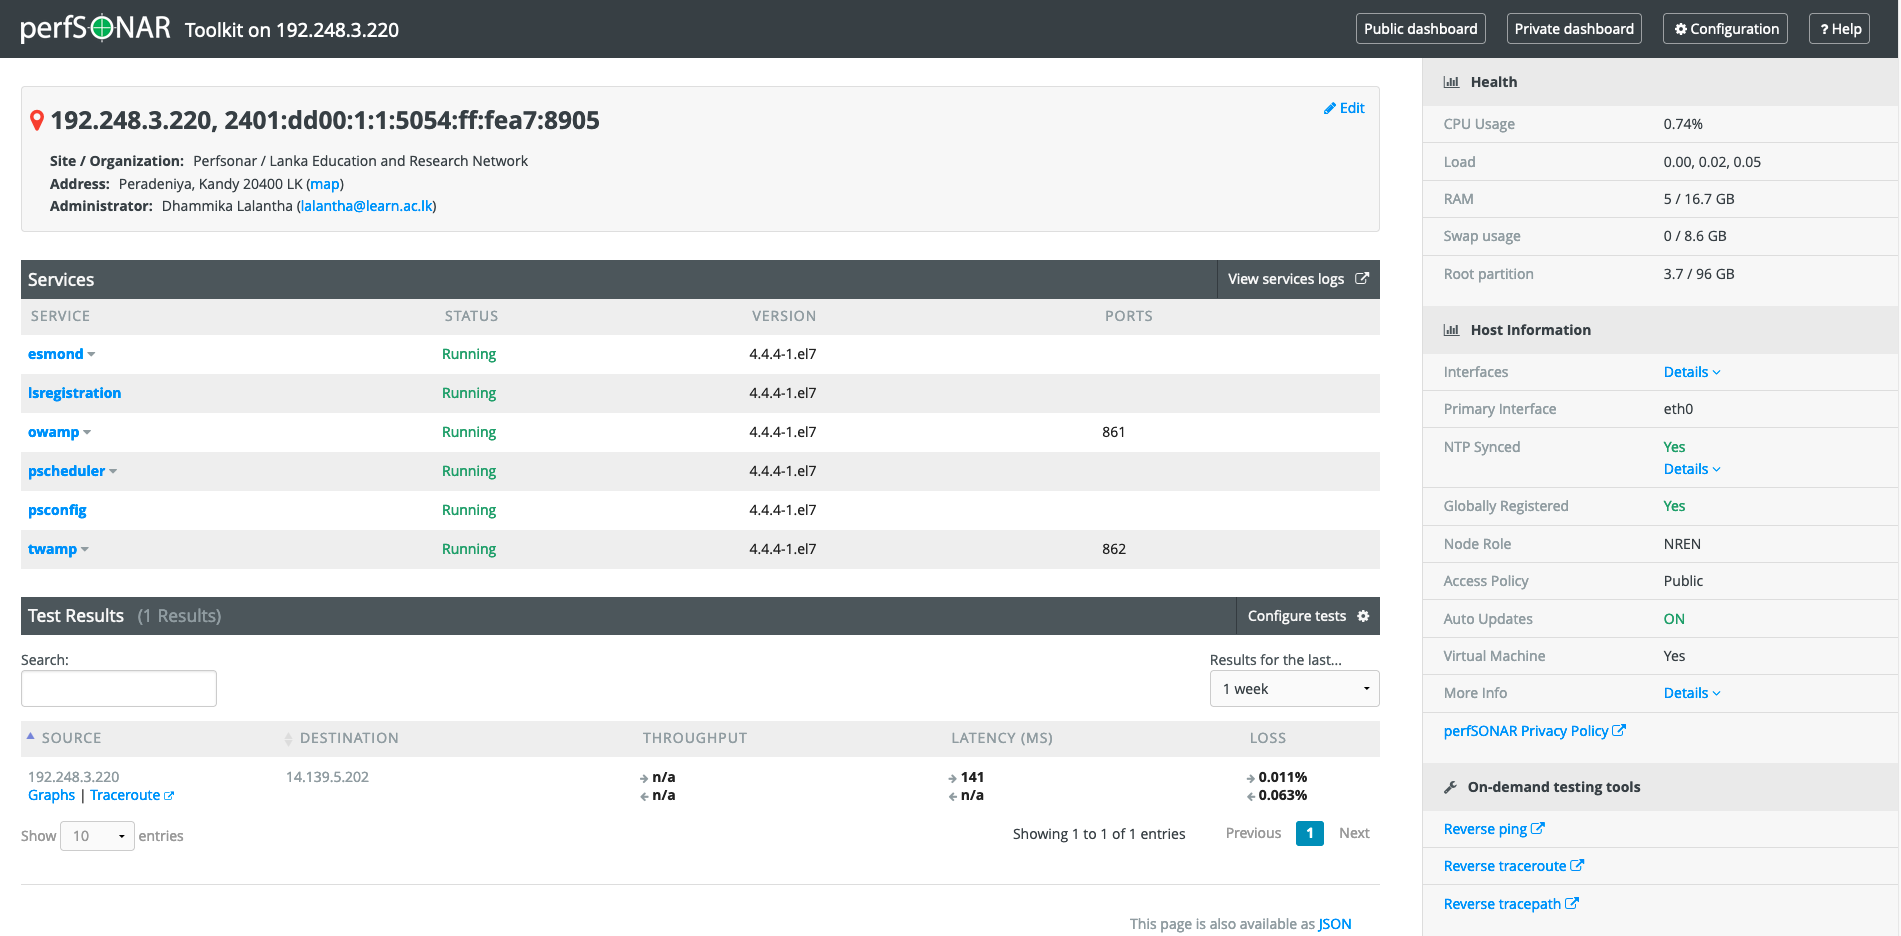
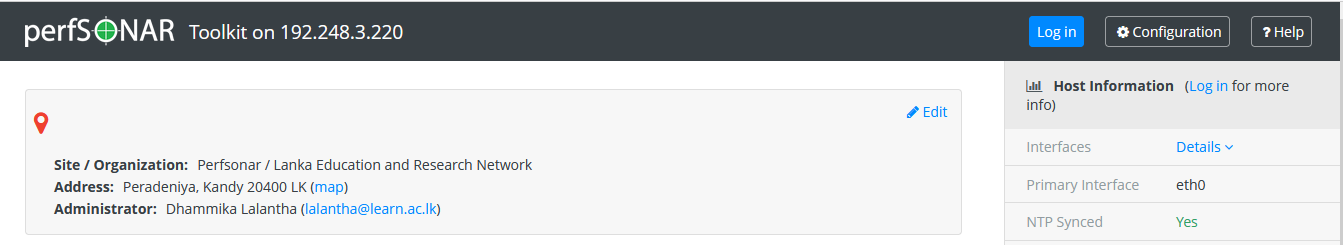
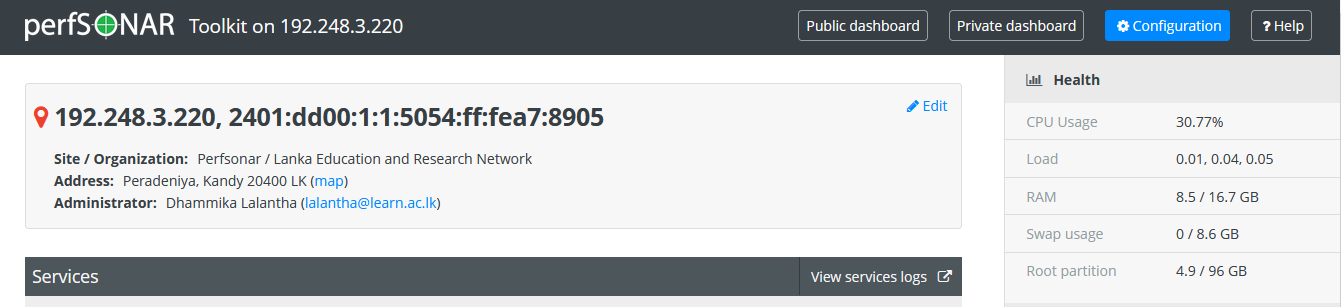
Once you login the perfSONAR web using https://[IP/Hostname]/toolkit you will see the below page.

On the toolkit dashboard there will sections for displaying different information. On the top will be node information like the IP address, Owner, Address and the administrator information.
On the right side there will be detailed host information such as Hardware profile, NTP status, Registration status, Access policy etc.
On the middle there will be a list of perfsonar services running and there will be another section at the bottom to show the Test results of the perfSONAR measurements tests.
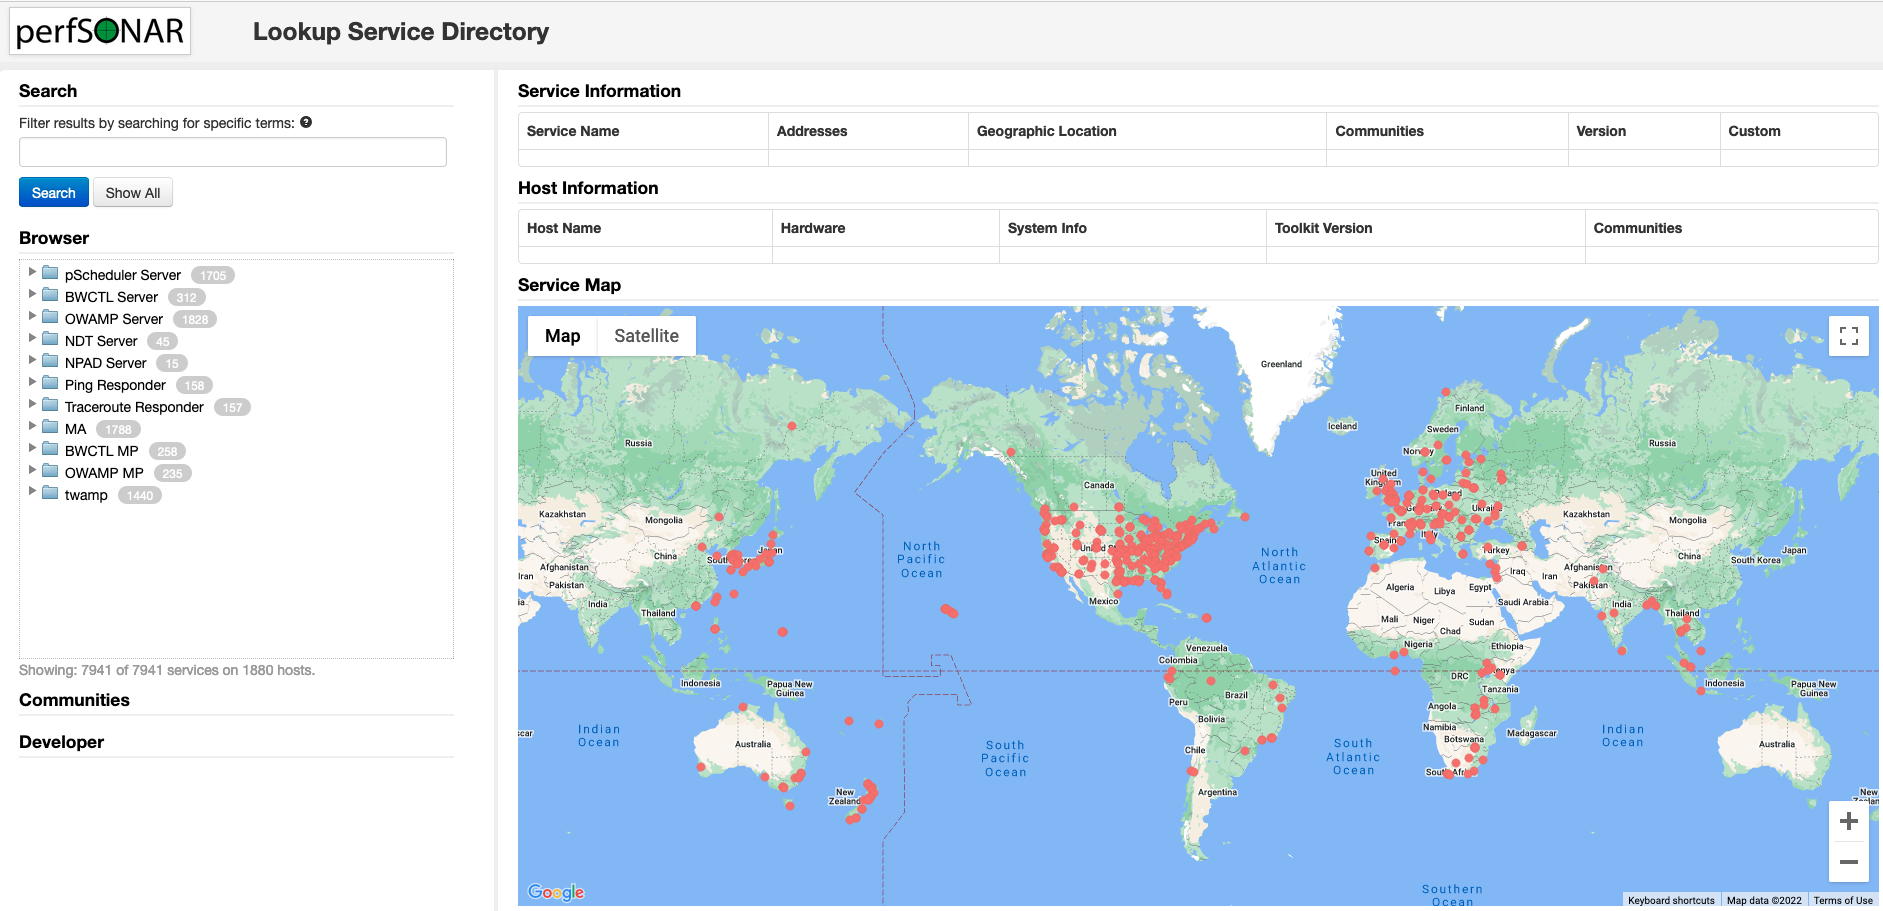
To conduct performance tests you will need at least another perfsonar node to test with. There are hundreds of perfsonar nodes installed world wide. You can find a node from any location you need by accessing this directory.

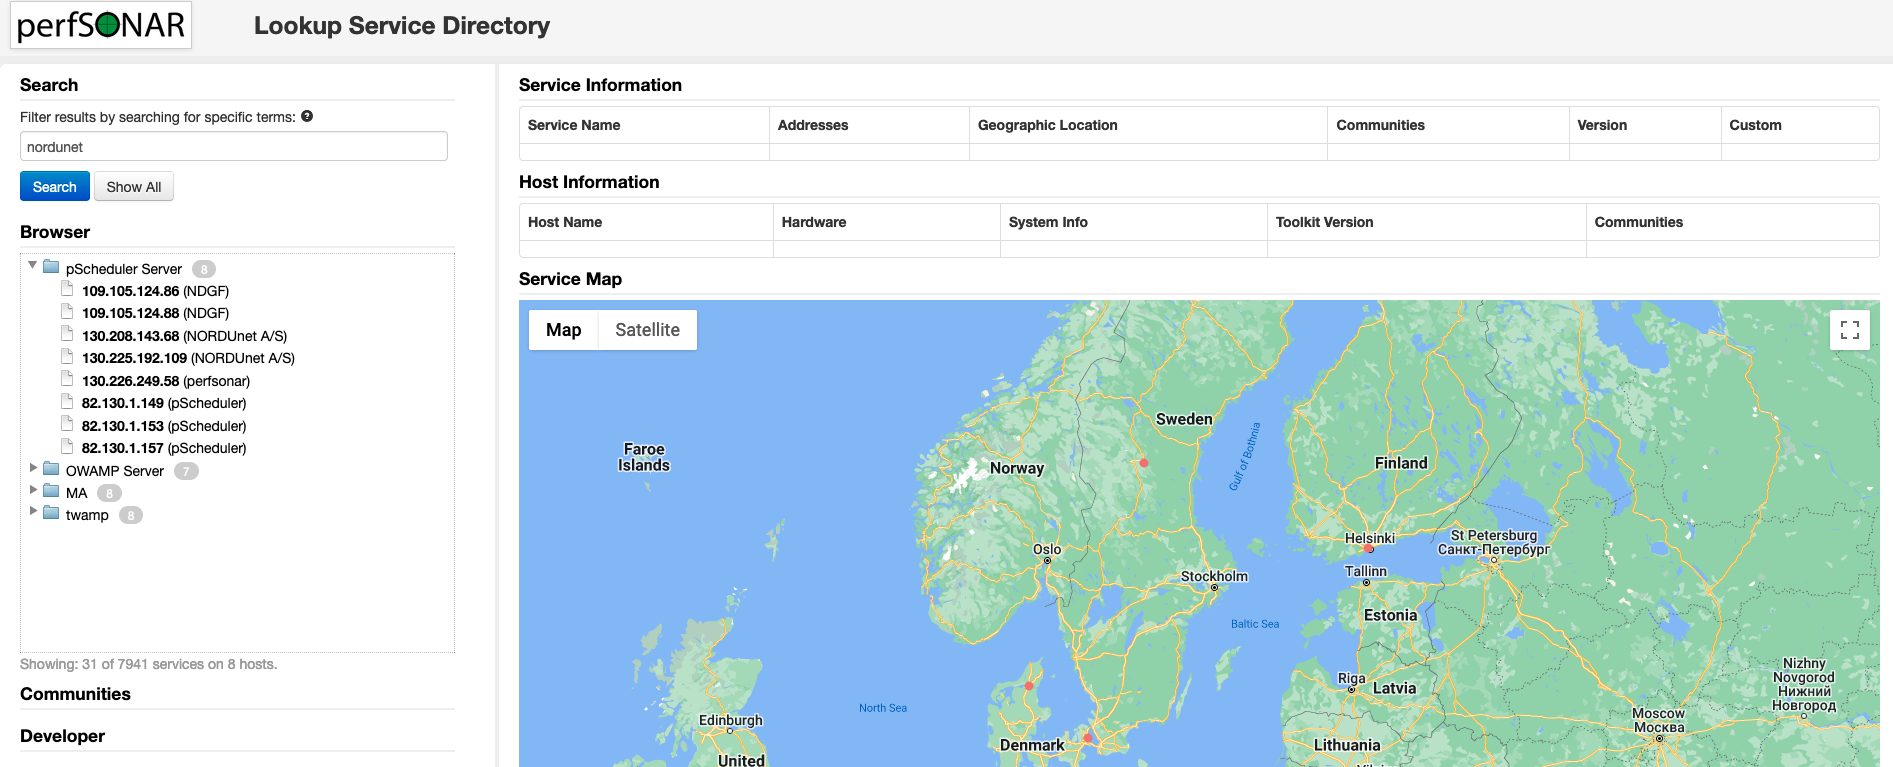
You can search the directory with any keyword, and here we will search for a node hosted by NORDUnet.

Conducting Regular Tests
A core function of the perfSONAR Toolkit is to run regularly scheduled network measurements. You can define the tests you want run through the toolkit’s web interface. There are four test types you can schedule and run through the web interface. They are One-Way Latency (Ping), Throughput, Round Trip Latency (Ping) and Traceroute tests.
One-Way Ping Test
Here we are going to schedule a test for testing One-way ping. For that we need a OWAMP service. In the OWAMP directory we can find a suitable perfSONAR node. Here we will select the highlighted node.
Now we will schedule a test and for that we need to first login to the perfSONAR. Click on Login at the top of the page.

Next click on Configuration.

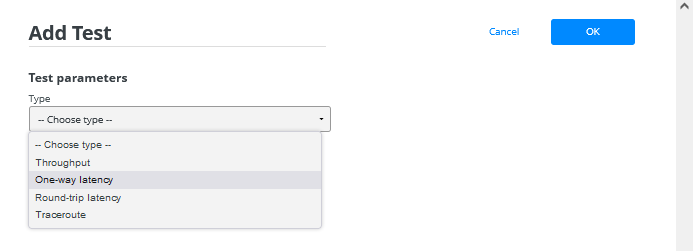
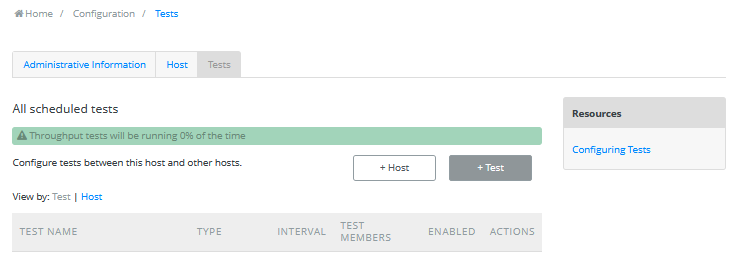
Then go to Tests tab and click on +Test to add new test.

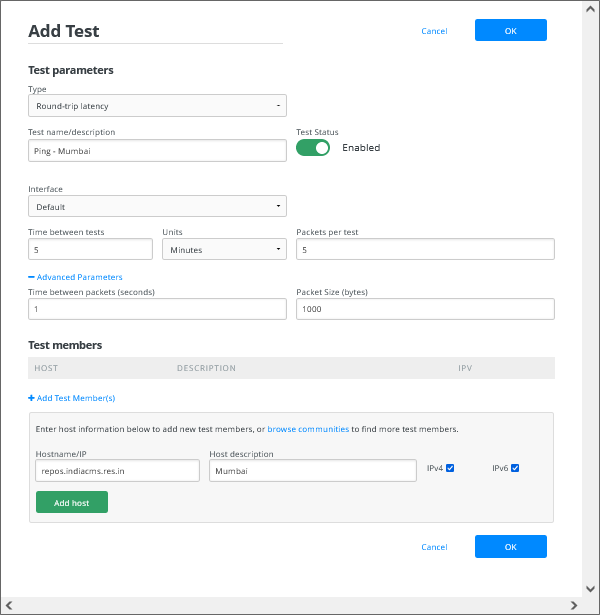
Next we have to choose the type of the test we need to add. In our case it is One-way latency.

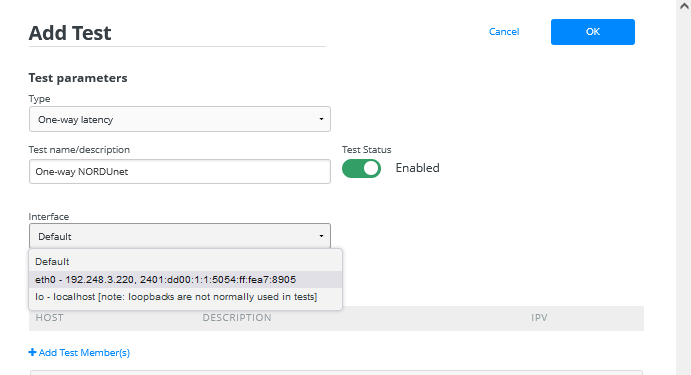
In the next field we have to choose the interface used for the test.

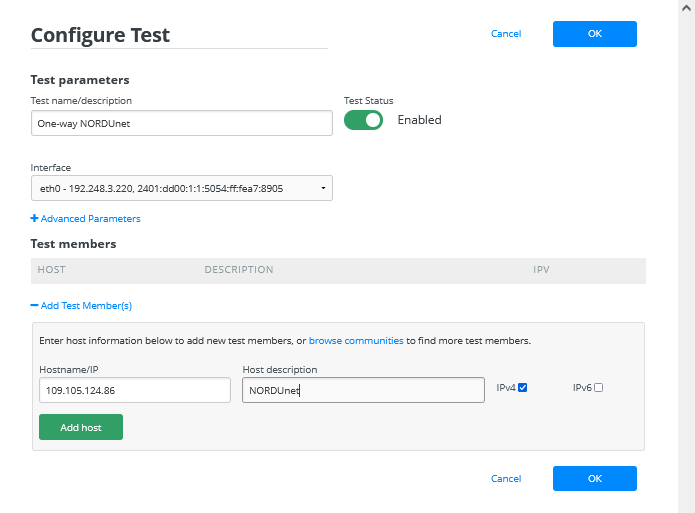
Then we will add the host or node we need to run the test with. We will enter the details of node we earlier searched for.

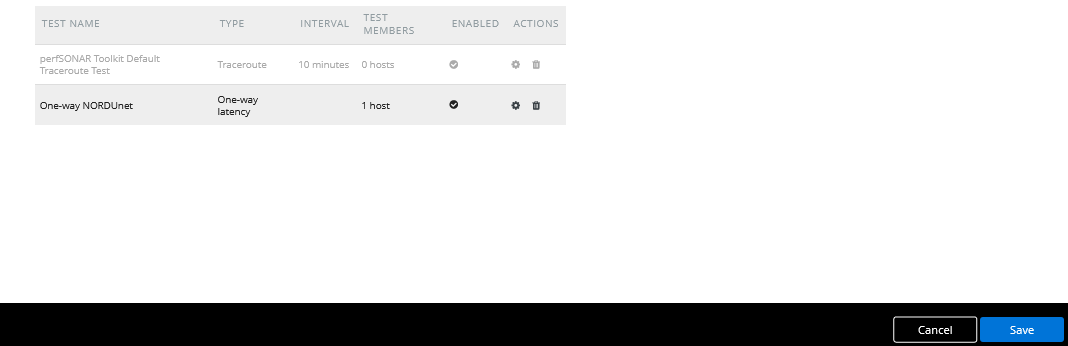
Once entered click OK. Next you will have to save the test created.

Now the test should run and after few minutes we can see the results by visiting the dashboard.
Throughput Test
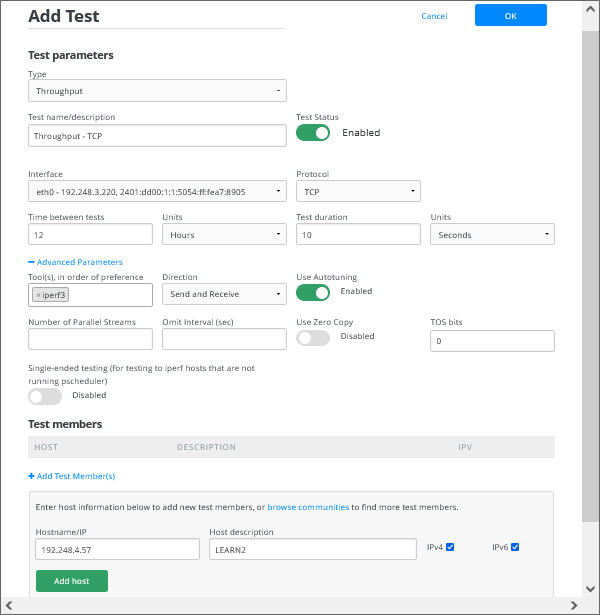
In the same way a we configured One-Way Latency test we will configure the Throughput test here. Below shows the whole configuration of the test.

Round Trip Latency (Ping) Test
Below shows the configuration of the Round Trip Latency test.

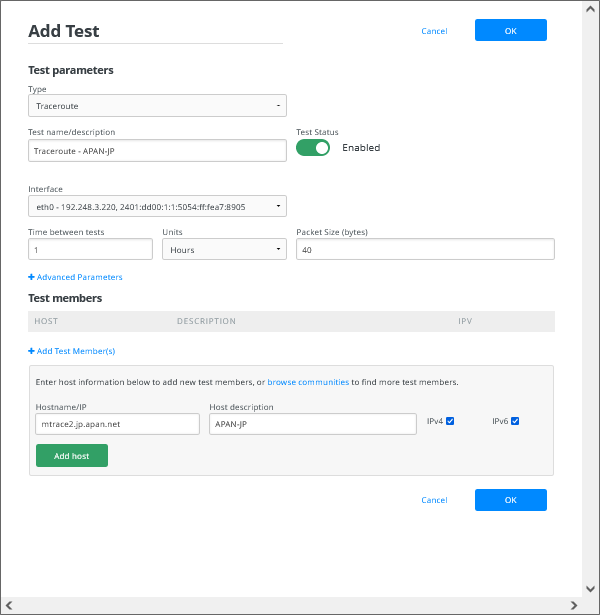
Traceroute Test
Below shows the configuration of the Traceroute test.

Conducting On-Demand Testing
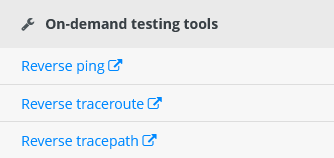
In addition to above tools perfsonar provides some On-Demand testing tools checking connectivity and path on the reverse path. These are listed in the right bottom side of the dashboard.

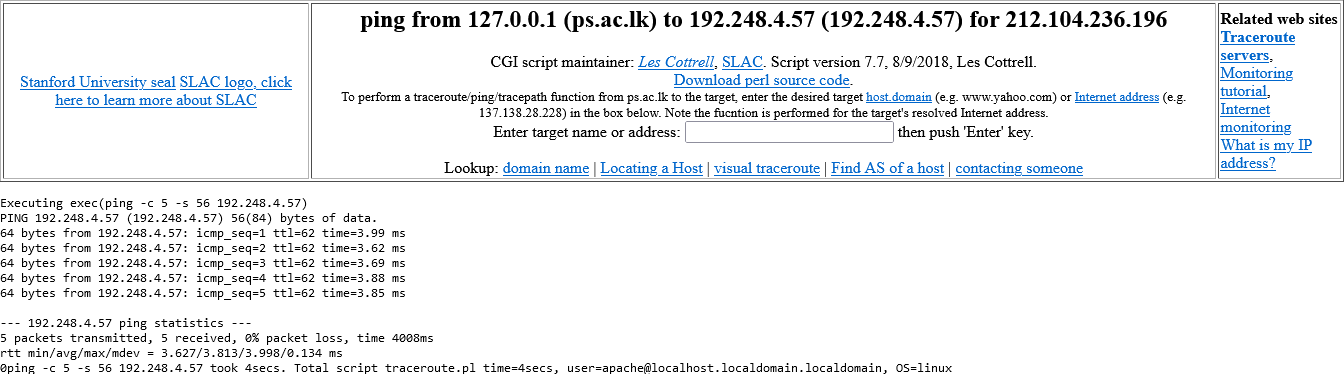
When you click on a test for a example Reverse Ping test it will open a new window run the test at once. By default the test will run from the perfsonar node the IP of the computer which browse the Toolkit. If your are inside a NATed network, the test will fail. But you can specify a target address you want to check and press enter to run the test.

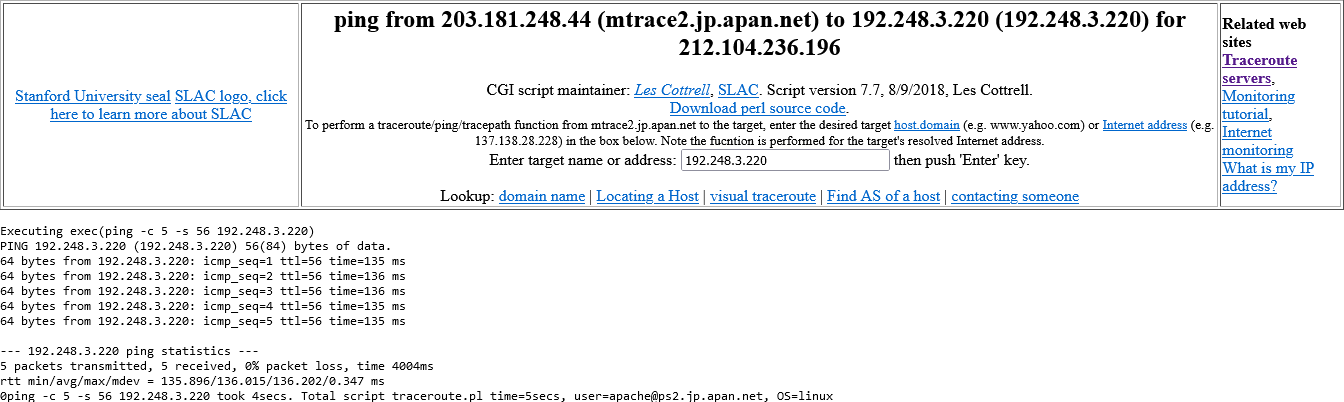
But it will be less useful to run the Reverse Ping or Reverse Traceroute test from your own perfSONAR node to a IP within your LAN. Most of the time you want to troubleshoot the reverse connectivity from remote server on which you may have a service to access or deployed. To use this scenario you need to access a toolkit website deployed on remote site. You can find the remote toolkit domain name or IP from the perfSONAR lookup directory. Below is an example test from a node at APAN-JP. For that you need to go to http://mtrace2.jp.apan.net/toolkit/ access the tool.

Viewing Graphs of Test Results
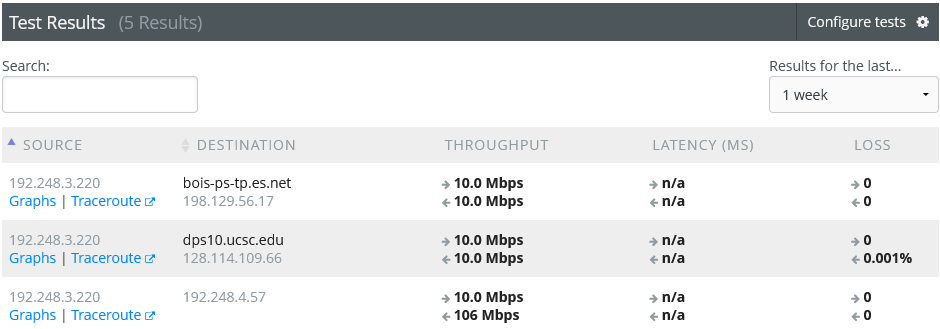
In perfSONAR test results are shown at the bottom section of the window. Toolkit also creates graphs based on test results so that user can view and analyse the measurements over the time. There is link for each test result and when you click on the link, the graphs will be displayed on a new page.

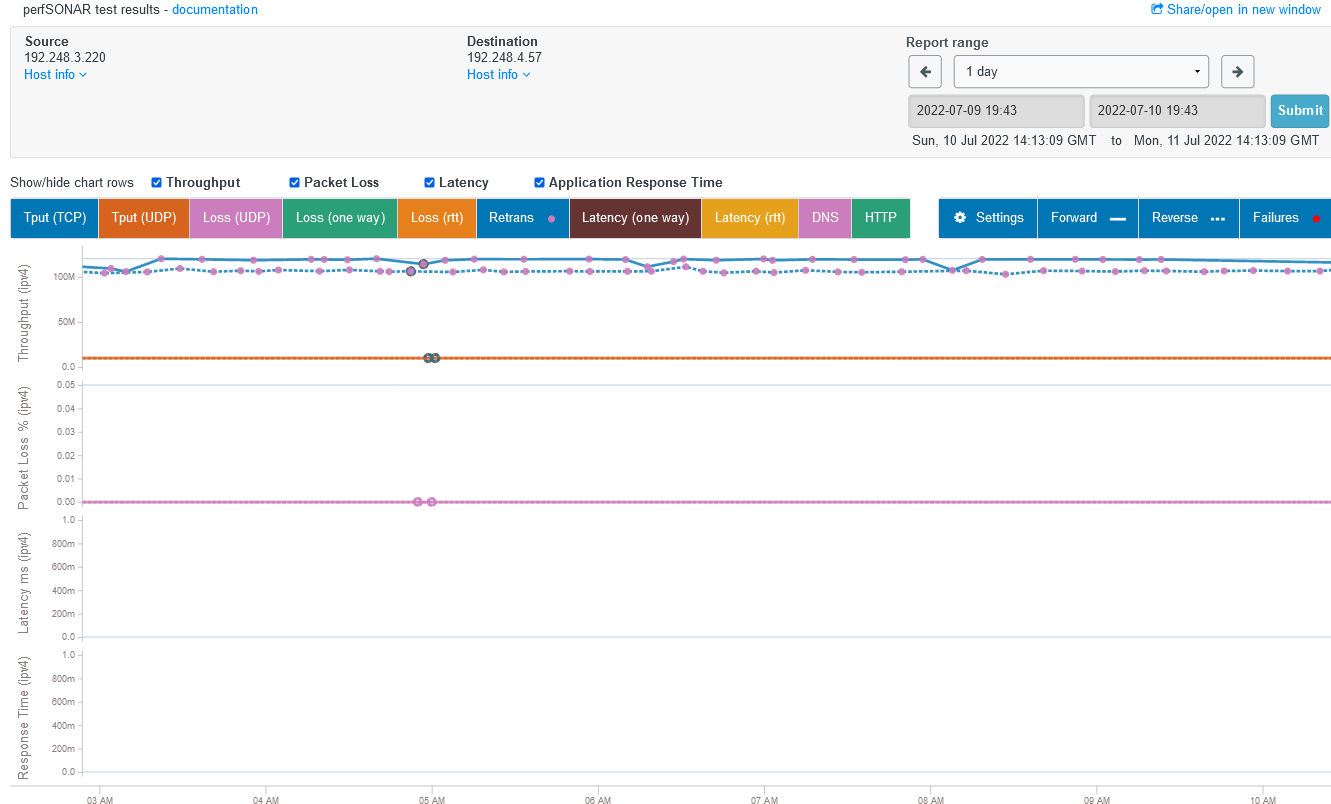
A sample graph shown below.

On the same time line there will be graphs for four different types of metrics. They are Throughput, Packet Loss, Latency and Response Time. The number of graphs shown will depend on the type of tests running between the selected perfSONAR nodes.
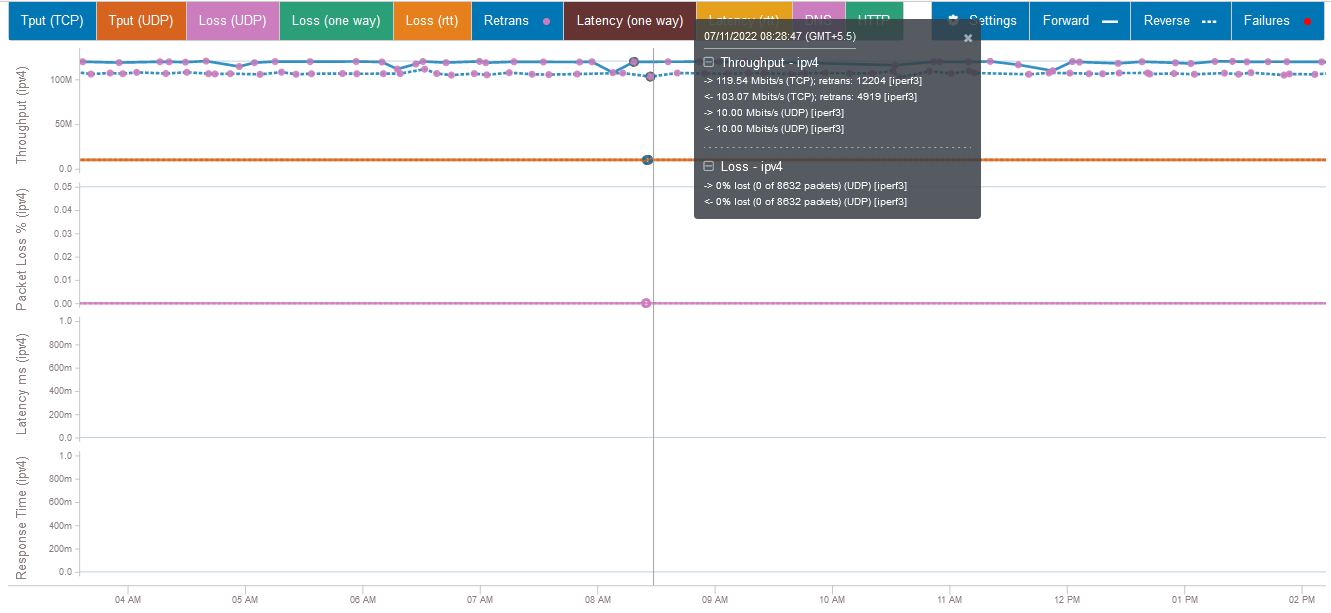
When you click on the graph at a particular point, it will pop-up a window showing the result at that particular time.

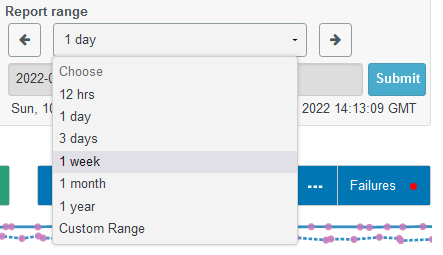
You can filter the graph results shown through the web interface. It has the options to choose a particualr time range or length per your choice.

Also you can filter the results based on type of metric, type of protocol and using the direction of the traffic etc.


Archiving Measurements with esmond
Archiving of measurement results for storage and processing is essential for any network measurement system. perfSONAR also supports several methods for these through several archivers. perfSONAR supports esmond, http, tcp, kafka, rabbitmq, syslog, bitbucket, failer etc.
In above all methods, esmond is more widely supported and scalable way to archive your measurement data. Here we will see how to archive the measurement data with esmond.
In practice measurement archives are setup in two ways.
First setup is the default configuration that every toolkit installation has. In a toolkit installation esmond archives will be in the same host.
Second is to have a central measurement archive for multiple perfSONAR nodes. A central measurement archive configuration is more the desirable way of archiving when have multiple perfSONAR nodes. It is also advantageous when your perfSONAR nodes are less powerful and when you want to archive data in multiple locations you can use this setup.
Displaying Measurements with MaDDash
Archiving or storing measuring data is less use if they cannot be presented in effective and convenient way. The Monitoring and Debugging Dashboard (MaDDash) software is aimed at collecting and presenting two-dimensional monitoring data as a set of grids referred to as a dashboard. Many monitoring systems focus on one dimension, such as a single host or service. Unfortunately, users can quickly run into n-squared problems both in terms of configuration on the back-end and data presentation on the front-end if you try to present naturally two-dimensional data in this manner.
Displaying Measurements with MaDDash in a Single Measurement Node
The default perfSONAR toolkit installation comes with esmond archiver installed and the measurement results are archived by default at the node itself. The archive can be accessed through the RESTful API from the below URL,
https://[perfSONAR-IP]/esmond/perfsonar/archive/
So we have nothing to do with archive configuration. Now we will install required MaDDash packages since they are not bundled with perfSONAR toolkit.
sudo yum install epel-release http://software.internet2.edu/rpms/el7/x86_64/latest/packages/perfSONAR-repo-0.10-1.noarch.rpm
sudo yum clean all
sudo yum install maddash
sudo yum install perfsonar-psconfig-maddash
Here you need to open some ports on linux firewall which is require for MaDDash web and esmond archiver.
firewall-cmd --permanent --add-port=80/tcp
firewall-cmd --permanent --add-port=443/tcp
firewall-cmd --reload
Next we have to create a pSConfig template for feeding measurement tasks to the perfSONAR node. Sample templates can be found at /usr/share/doc/perfsonar/psconfig/ on the central measurement archive server. skeleton.json is basic sample configuration file to start with.
Below is the configuration file that we are going to use in this installation. Now to create the file,
sudo nano /etc/perfsonar/psconfig/<filename>.json
Please give a preferred filename above. Now copy and paste the below content. In the configuration you can customize the display-name attribute to your institute name. Also here you have to replace PS_IP with the IP address of your perfsonar node which is the same host that the MaDDash is installed.
{
   "_meta":{
      "display-name":"<Institute> Measurements"
   },
   "addresses":{
      "PS":{
         "address":"<PS_IP>"
      },
      "Moscow":{
         "address":"t1-pfsn2.jinr-t1.ru"
      },
      "NSRC":{
         "address":"109.105.124.86"
      },
      "NORDUnet":{
         "address":"perfsonar-ps.ndgf.org"
      }
   },
   "archives":{
      "esmond_archive":{
         "archiver":"esmond",
         "data":{
            "measurement-agent":"{% scheduled_by_address %}",
            "url":"https://<PS_IP>/esmond/perfsonar/archive/"
         }
      }
   },
   "groups":{
      "group_disjoint":{
         "a-addresses":[
            {
               "name":"PS"
            }
         ],
         "b-addresses":[
            {
               "name":"Moscow"
            },
            {
               "name":"NSRC"
            },
            {
               "name":"NORDUnet"
            }
         ],
         "type":"disjoint"
      }
   },
   "schedules":{
      "schedule_PT10M":{
         "repeat":"PT10M",
         "slip":"PT10M",
         "sliprand":true
      },
      "schedule_PT4H":{
         "repeat":"PT4H",
         "slip":"PT4H",
         "sliprand":true
      }
   },
   "tests":{
      "test_rtt":{
         "spec":{
            "dest":"{% address[1] %}",
            "source":"{% address[0] %}"
        },
         "type":"rtt"
      },
      "test_throughput":{
         "spec":{
            "dest":"{% address[1] %}",
            "duration":"PT30S",
            "source":"{% address[0] %}"
         },
         "type":"throughput"
      },
      "test_trace":{
         "spec":{
            "dest":"{% address[1] %}",
            "source":"{% address[0] %}"
         },
         "type":"trace"
      }
   },
   "tasks":{
      "task_rtt":{
         "_meta":{
            "display-name":"Ping Tests"
         },
         "archives":[
            "esmond_archive"
         ],
         "group":"group_disjoint",
         "test":"test_rtt"
      },
      "task_throughput":{
         "_meta":{
            "display-name":"Throughput Tests"
         },
         "archives":[
            "esmond_archive"
         ],
         "group":"group_disjoint",
         "schedule":"schedule_PT4H",
         "test":"test_throughput"
      },
      "task_trace":{
         "_meta":{
            "display-name":"Traceroute Tests"
         },
         "archives":[
            "esmond_archive"
         ],
         "group":"group_disjoint",
         "schedule":"schedule_PT10M",
         "test":"test_trace"
      }
   }
}
You can run below to validate file for any syntax errors,
jq . <filename>.json
Now we will add pSConfig template as a local template.
sudo psconfig remote add /<Path-To-Template>/<filename>.json"
Now restart below services to make the changes to be effect.
sudo systemctl restart cassandra
sudo systemctl restart maddash-server
sudo systemctl restart psconfig-maddash-agent
sudo systemctl restart psconfig-pscheduler-agent
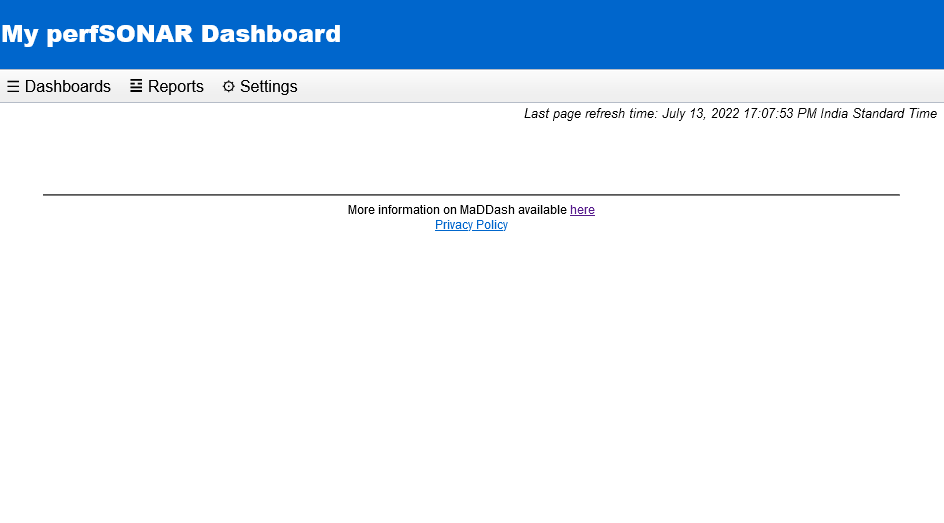
Now visit the MaDDash web interface from https://<PS_IP>/maddash-webui. You should be able to Dashboard items like below.

You can now customize the Dashboard items by accessing below configuration file,
sudo nano /etc/maddash/maddash-webui/config.json
Please edit the title and defaultDashboard items as appropriate
{
    "title":"My perfSONAR Dashboard",
    "defaultDashboard": "My Sites",
    "enableAdminUI": true,
    "grids":{
	"OWAMP":{
            "cellSize": 13,
            "cellPadding": 3
        }
    },
...
Setting up Central Measurement Archive and MadDash for Multiple Measurement Nodes
In this example we have two or more perfSONAR nodes and a single archive host for storing data.Here we will use a single central server for both archiving (esmond) and installing the MaDDash as well.
Step 1: Before installation the packages we have to update the system and install package repository.
sudo yum update

sudo yum install epel-release

sudo yum install http://software.internet2.edu/rpms/el7/x86_64/latest/packages/perfSONAR-repo-0.10-1.noarch.rpm

sudo yum clean all
Step 2: first we will install perfsonar-centralmanagement package in the central server(MA) which contains the MaDDash, esmond as well as other supporting packages like psconfig MadDash Agent.
sudo yum install perfsonar-centralmanagement
Step 3: Here you need to open some ports on linux firewall which is require for MaDDash web and esmond archiver.
firewall-cmd --permanent --add-port=80/tcp
firewall-cmd --permanent --add-port=443/tcp
firewall-cmd --reload
After the installation you should be able to access the MaDDash web interface through https://central-ma-ip/maddash-webui.

Step 4: Next we have to create a pSConfig template for feeding measurement tasks to the perfSONAR nodes. Sample templates can be found at /usr/share/doc/perfsonar/psconfig/ on the central measurement archive server. skeleton.json is basic sample configuration file to start with. Below is the configuration file that we are going to use in this installation.
{
    "_meta":{
        "display-name": "LEARN Measurements"
    },

    "archives": {
        "example_esmond_archive": {
            "archiver": "esmond",
            "data": {
                "measurement-agent": "{% scheduled_by_address %}",
                "url": "https://MA_IP/esmond/perfsonar/archive/"
            }
        }
    },

    "addresses": {
        "PS1": { "address": "PS1_IP" },
        "PS2": { "address": "PS2_IP" },
        "NSRC": { "address": "perfsonar.nsrc.org" }
    },

    "groups": {
        "example_group_mesh": {
            "type": "mesh",
            "addresses": [
                { "name": "PS1" },
                { "name": "PS2" },
                { "name": "NSRC" }
            ]

        }
    },

    "tests": {
        "example_test_throughput": {
            "type": "throughput",
            "spec": {
                "source": "{% address[0] %}",
                "dest": "{% address[1] %}",
                "duration": "PT30S"
            }
        },
        "example_test_latencybg": {
            "type": "latencybg",
            "spec": {
                "source": "{% address[0] %}",
                "dest": "{% address[1] %}",
                "flip": "{% flip %}"
            }
        },
        "example_test_trace": {
            "type": "trace",
            "spec": {
                "source": "{% address[0] %}",
                "dest": "{% address[1] %}"
            }
        }
    },

    "schedules": {
        "example_schedule_PT4H": {
            "repeat": "PT4H",
            "sliprand": true,
            "slip": "PT4H"
        },
        "example_schedule_PT10M": {
            "repeat": "PT10M",
            "sliprand": true,
            "slip": "PT10M"
        }
    },

    "tasks": {
        "example_task_throughput": {
            "group": "example_group_mesh",
            "test": "example_test_throughput",
            "schedule": "example_schedule_PT4H",
            "archives": [ "example_esmond_archive" ],
            "_meta": {
                "display-name": "Example Throughput Tests"
            }
        },
        "example_task_latencybg": {
            "group": "example_group_mesh",
            "test": "example_test_latencybg",
            "archives": [ "example_esmond_archive" ],
            "_meta": {
                "display-name": "Example Loss Tests"
            }
        },
        "example_task_trace": {
            "group": "example_group_mesh",
            "test": "example_test_trace",
            "schedule": "example_schedule_PT10M",
            "archives": [ "example_esmond_archive" ],
            "_meta": {
                "display-name": "Example Traceroute Tests"
            }
        }
    }
}
You can run below to validate file for any syntax errors,
jq . learn.json
Step 5. Next you need publish the configuration file to web so that perfSONAR nodes and the MaDDash server itself can consume the configuration required to run tests.
psconfig publish learn.json
Now the published file uploaded to the web can be accessed through the link https://MA_IP/psconfig/learn.json.
Step 6. Our plan is to send the archive data from perfSONAR nodes to archive host. But first archive host should be configured to accept the data from perfsonar nodes. To do that enter below command.
sudo esmond_manage add_user_ip_address username PS1_IP
Username can be anything and it is only for local reference of the Archive server. Below is the output of the successful command execution.
esmond [INFO] Checking/creating column families
esmond [INFO] Schema check done
esmond [DEBUG] Opening ConnectionPool
esmond [INFO] Connected to ['localhost:9160']
User learn exists
Setting metadata POST permissions.
api | ps metadata | Can add ps metadata
api | ps metadata | Can change ps metadata
api | ps metadata | Can delete ps metadata
api | ps point to point subject | Can add ps point to point subject
api | ps point to point subject | Can change ps point to point subject
api | ps point to point subject | Can delete ps point to point subject
api | ps event types | Can add ps event types
api | ps event types | Can change ps event types
api | ps event types | Can delete ps event types
api | ps metadata parameters | Can add ps metadata parameters
api | ps metadata parameters | Can change ps metadata parameters
api | ps metadata parameters | Can delete ps metadata parameters
api | ps network element subject | Can add ps network element subject
api | ps network element subject | Can change ps network element subject
api | ps network element subject | Can delete ps network element subject
Setting timeseries permissions.
Creating entry for IP [PS1_IP] belonging to [username]
In the same way add the user and IP address of the second perfSONAR node.
sudo esmond_manage add_user_ip_address username PS2_IP
Step 7. Now we should let the Archive server know where the pSConfig template lives. Then it can locate the archive and display the data through the MaDDash. Enter the below for that,
psconfig remote add "https://MA_IP/psconfig/learn.json"
Now restart below services to make the changes to be effect.
systemctl restart cassandra
systemctl restart maddash-server
systemctl restart psconfig-maddash-agent
Step 8. Now you should switch to the perfSONAR nodes. On each node execute the below commands. These make the nodes consume the psconfig template file and executes the tasks on it. It also tells the nodes to send archive data to the Central Measurement Archive.
On Central Measurement Archive,
psconfig remote add --configure-archives "https://[MA_IP]/psconfig/learn.json"
Then you should restart the below service,
systemctl restart psconfig-pscheduler-agent
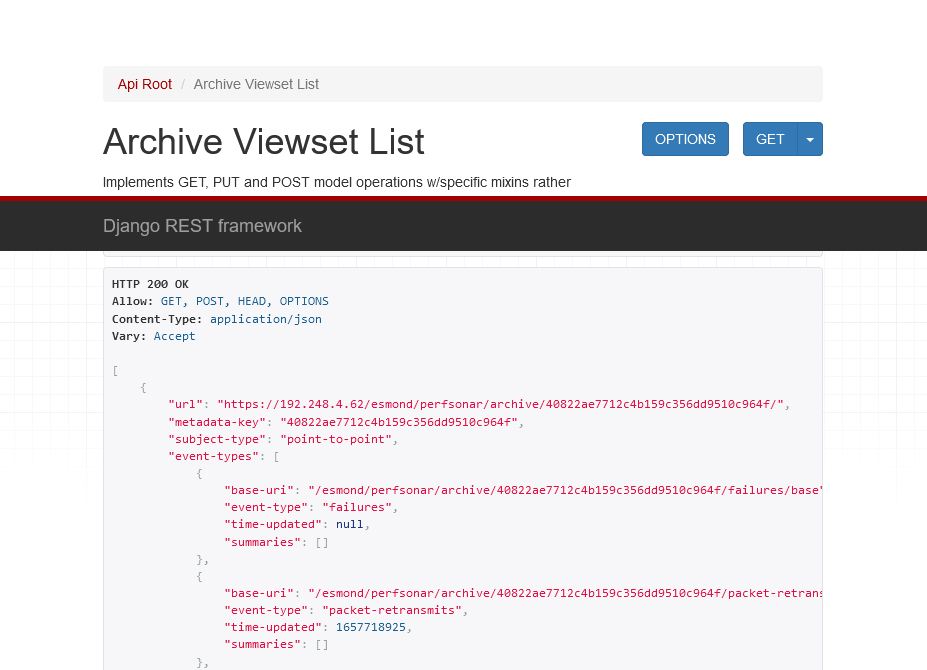
If everything is successful you should see archive data receiving to the Central Measurement Archive server. Visit the url https://[MA_IP]/esmond/perfsonar/archive/ and you should see something like below,

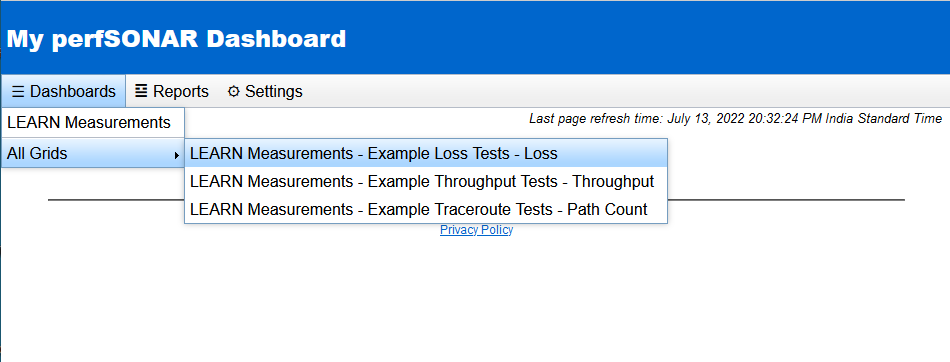
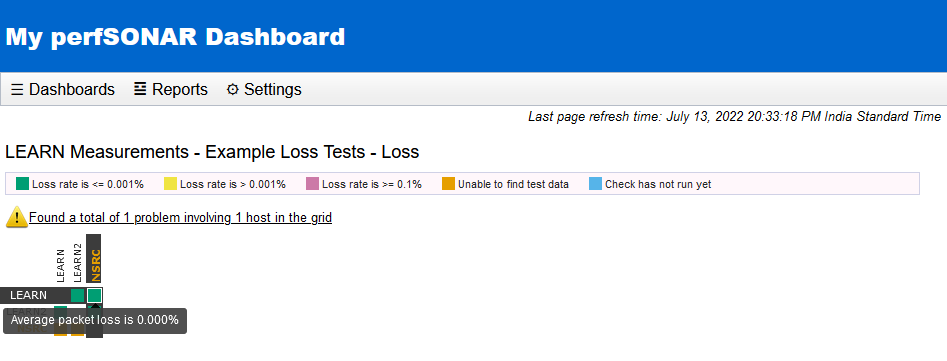
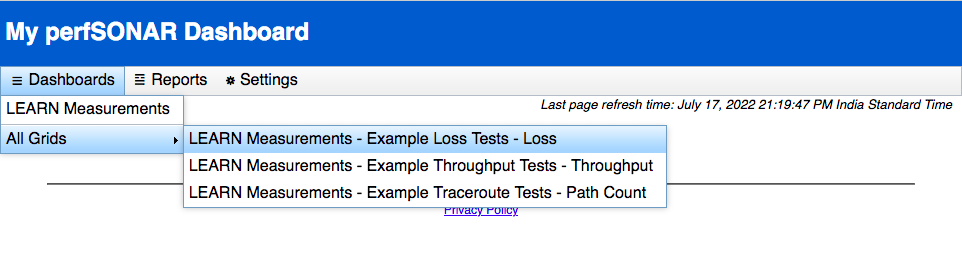
Now visit the MaDDash web interface from https://[MA_IP]/maddash-webui. You should be able to Dashboard items like below.

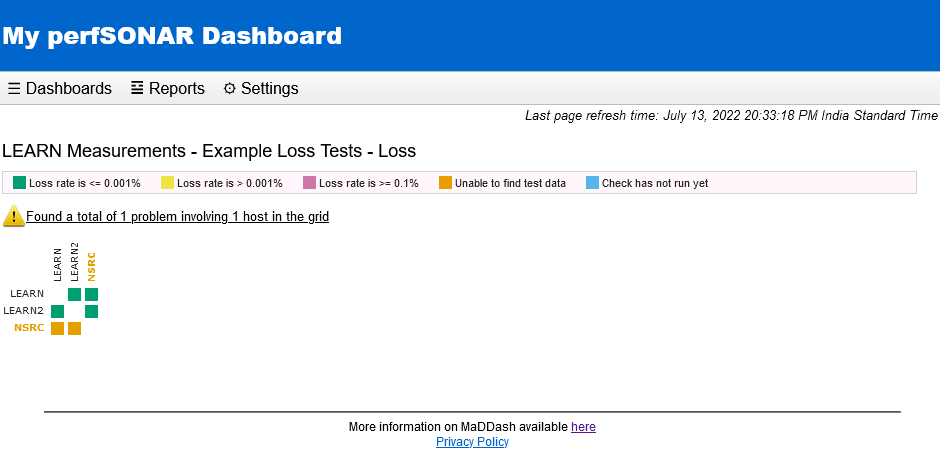
Click on a grid item to view the results of a type of test,

Hover on the grid to view the test results.

Attachments (28)
- ps8.png (213.1 KB ) - added by 4 years ago.
- ps9.png (476.8 KB ) - added by 4 years ago.
- ps10.png (555.4 KB ) - added by 4 years ago.
- ps12.png (39.8 KB ) - added by 4 years ago.
- ps13.png (43.5 KB ) - added by 4 years ago.
- ps15.png (7.7 KB ) - added by 4 years ago.
- ps16.png (14.8 KB ) - added by 4 years ago.
- ps17.png (17.4 KB ) - added by 4 years ago.
- ps18.png (15.0 KB ) - added by 4 years ago.
- ps14.png (13.6 KB ) - added by 4 years ago.
- ps19.png (32.4 KB ) - added by 4 years ago.
- ps20.png (41.3 KB ) - added by 4 years ago.
- ps21.png (31.2 KB ) - added by 4 years ago.
- ps22.png (7.4 KB ) - added by 4 years ago.
- ps24.png (60.5 KB ) - added by 4 years ago.
- ps25.png (63.9 KB ) - added by 4 years ago.
- ps26.png (38.8 KB ) - added by 4 years ago.
- ps27.png (73.8 KB ) - added by 4 years ago.
- ps28.png (44.6 KB ) - added by 4 years ago.
- ps29.png (13.9 KB ) - added by 4 years ago.
- ps30.png (10.8 KB ) - added by 4 years ago.
- ps31.png (3.0 KB ) - added by 4 years ago.
- ps32.png (21.4 KB ) - added by 4 years ago.
- ps33.png (49.7 KB ) - added by 4 years ago.
- ps34.png (21.2 KB ) - added by 4 years ago.
- ps35.png (30.1 KB ) - added by 4 years ago.
- ps36.png (19.1 KB ) - added by 4 years ago.
- ps37.png (64.4 KB ) - added by 4 years ago.
Download all attachments as: .zip