
| Version 16 (modified by , 8 years ago) ( diff ) |
|---|
Monitoring Netflow Using nfdump/nfsen
You will install nfdump and nfsen in this hands-on.
Note: You will install nfdump/nfsen on NetMon VM. Therefore shutdown the librenms VM.
sudo shutdown now
Then start NetMon VM
install nfdump
First install dependancies
$ sudo apt-get install build-essential autoconf
$ sudo apt-get install rrdtool mrtg librrds-perl librrdp-perl librrd-dev \
       libmailtools-perl bison flex
You might get a box asking Make /etc/mrtg.cnf owned by and readable only by root? select yes.
Now proceed to download and build. Note that only the last step (make install) has to be done as root.
$ cd
$ wget http://192.248.4.49/NetMon/nfdump-1.6.13.tar.gz
$ tar xvzf nfdump-1.6.13.tar.gz
$ cd nfdump-1.6.13
$ ./configure --help      # optional, shows the build settings available
$ ./configure --enable-nfprofile --enable-nftrack --enable-sflow
$ make
$ sudo make install
Router Configuration
Note: This part is already done for you.
Cisco Router
Let's configure netflow on a cisco router
- Log in to the router and go to configuration mode
Router>enable
Password:
#configure terminal
Router(config)#
- Create an exporter profile with the IP Address of the server where you have configure the nfdump and the transport port.
flow exporter EXPORTER-1
 description Export to nfdump
 destination <IP Address>
 transport udp <port>
 template data timeout 60
- Define the flow monitor for IPv4 and call the created exporter.
flow monitor FLOW-MONITOR-V4
 exporter EXPORTER-1
 record netflow ipv4 original-input
 cache timeout active 300
- Define the flow monitor for IPv6 and call the created exporter.
flow monitor FLOW-MONITOR-V6
 exporter EXPORTER-1
 record netflow ipv6 original-input
 cache timeout active 300
- Add the moniter profile to the Interface that export the flows
interface FastEthernet 0/0
 ip flow monitor FLOW-MONITOR-V4 input
 ip flow monitor FLOW-MONITOR-V4 output
  ipv6 flow monitor FLOW-MONITOR-V6 input
  ipv6 flow monitor FLOW-MONITOR-V6 output
- Save the configuration
HP Router
- Login to the router and go to Configure mode
<Router>system-view
[Router]
- Create the sflow agent and sflow source IP. (Interface IP of the interface that export the flow)
sflow agent ip <IP Address>
sflow source ip <IP Address>
- Define the sflow collector with the nfdump server IP and transport port.
sflow collector 1 ip <IP Address> port <Port> description "Export to nfdump"
- Call the sflow collector fromm the interface and define other parameters.
interface GigabitEthernet0/0
 sflow flow collector 1
 sflow sampling-rate 4000
 sflow counter collector 1
 sflow counter interval 120
- Save the configuration
Testing nfcapd/sfcapd and nfdump
If your institutes access router uses netflow you shloud use nfcapd. If it uses sflow you should use sfcapd. You can find your router's flow expoter from this table
For a netflow router
$ mkdir /tmp/nfcap-test
$ nfcapd -E  -p 9001 -l /tmp/nfcap-test
... after a while, a series of flows should be dumped on your screen.
Stop the tool with CTRL+C, then look at the contents of /tmp/nfcap-test
$ ls -l /tmp/nfcap-test
You should see one or more files called nfcapd.<YEAR><MON><DAY><HR><MIN>
Process the file(s) with nfdump:
nfdump -r /tmp/nfcap-test/nfcapd.201Ywwxxyyzz | less
nfdump -r /tmp/nfcap-test/nfcapd.201Ywwxxyyzz -s srcip/bytes
w,x,y,z indicate year, month, day and time.
For a sflow router
$ mkdir /tmp/sfcap-test
$ sfcapd -E  -p 9001 -l /tmp/sfcap-test
... after a while, a series of flows should be dumped on your screen.
Stop the tool with CTRL+C, then look at the contents of /tmp/nfcap-test
$ ls -l /tmp/sfcap-test
You should see one or more files called sfcapd.<YEAR><MON><DAY><HR><MIN>
Process the file(s) with nfdump:
nfdump -r /tmp/sfcap-test/nfcapd.201Ywwxxyyzz | less
nfdump -r /tmp/sfcap-test/nfcapd.201Ywwxxyyzz -s srcip/bytes
w,x,y,z indicate year, month, day and time.
Installing and setting up NfSen
Download and compile nfsen.
$ cd
$ wget http://wget http://192.248.4.49/NetMon/nfsen-1.3.6p1.tar.gz
$ tar xvzf nfsen-1.3.6p1.tar.gz
$ cd nfsen-1.3.6p1
$ perl -MCPAN -e 'install Socket6'
Would you like to configure as much as possible automatically? [yes]
What approach do you want? (Choose local::lib, sudo or manual)
[local::lib]
$ cd etc
$ cp nfsen-dist.conf nfsen.conf
$ vi nfsen.conf
Set the $BASEDIR variable
$BASEDIR = "/var/nfsen";
Set the users appropriately so that Apache can access files:
$WWWUSER = 'www-data';
$WWWGROUP = 'www-data';
Set the buffer size to something small, so that we see data quickly. You would not do this on a production system.
# Receive buffer size for nfcapd - see man page nfcapd(1)
$BUFFLEN = 2000;
Find the %sources definition, and change it to:
For a netflow router
%sources=(
'accessrtr' => {'port'=>'9001','col'=>'#0000ff','type'=>'netflow'},
 );
For a sflow router
%sources=(
'accessrtr' => {'port'=>'9001','col'=>'#0000ff','type'=>'sflow'},
 );
(substitute your group's router for accessrtr, and either remove or comment out the existing sample sources).
Change the HTMLDIR from /var/www/nfsen/ to /var/www/html/nfsen/
$HTMLDIR = "/var/www/html/nfsen/";
Now save and exit from the file.
Default rrd tool version for nfsen is 1.5 but the latest version 1.6 therefore a slight configuration is needed
cd
vi nfsen-1.3.6p1/libexec/NfSenRRD.pm
Find the following line'
if ( $rrd_version >= 1.2 && $rrd_version < 1.5 )
change it to,
if ( $rrd_version >= 1.2 && $rrd_version < 1.6 )
Create the netflow user on the system
$ sudo useradd -d /var/nfsen -G www-data -m -s /bin/false netflow
Install NfSen and start it
Change directory back to just inside the source directory:
$ cd
$ cd nfsen-1.3.6p1
Now, finally, we install:
$ sudo perl install.pl etc/nfsen.conf
Press ENTER when prompted for the path to Perl.
Install init script
In order to have nfsen start and stop automatically when the system starts, add a link to the init.d diretory pointing to the nfsen startup script:
$ sudo ln -s /var/nfsen/bin/nfsen /etc/init.d/nfsen
$ sudo update-rc.d nfsen defaults 20
Start NfSen
$ sudo service nfsen start
View flows via the web:
You can find the nfsen page here:
http://<your IP address>/nfsen/nfsen.php
You may see a message such as:
Frontend - Backend version mismatch'''
This will go away if you reload the page, it's not a problem.
Using NfSen to identify top talkers
Now let's use NfSen to explore the traffic flows in the network, with the aim of finding out who was been downloading the most data. Look carefully at the output generated at each step - ask an instructor to explain if you don't understand what you see.
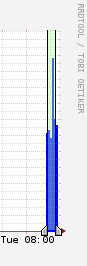
- Navigate to Detail page
- Select time window. to do that change from "Single Timeslot" to Time Window. Once you have done this, the vertical selector arrow and line in the graph window can be split.

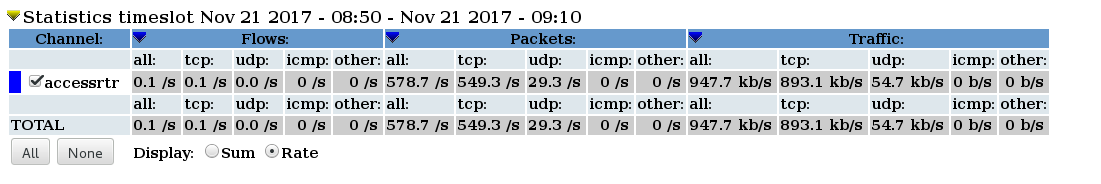
- Pull the left half of the arrow to the left and the right half to the right, to select the time period of interest. Then you should see some summary statistics appear in the table below the graph, for the time period you have selected

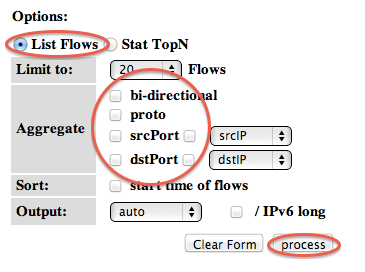
- List individual flows by Selecting "List Flows", make sure none of the "Aggregate" boxes are checked, and then click process. This will display some flows at the beginning of the time period. Click process. You will see the top flows below.

- By selecting "bi-directional" you can get NfSen to associate the inbound and outbound flows into a single line
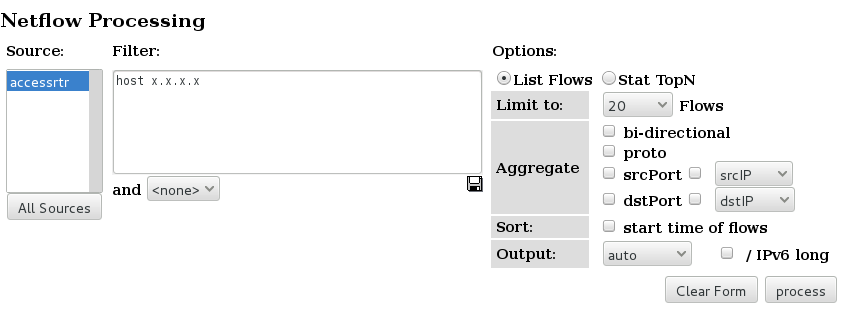
- If we know which host we want to examine, we can apply a filter to show only those flows to and from that host. Do this by entering "host x.x.x.x" in the filter box, and then pressing process again. (Replace x.x.x.x with the address of one of host PC)

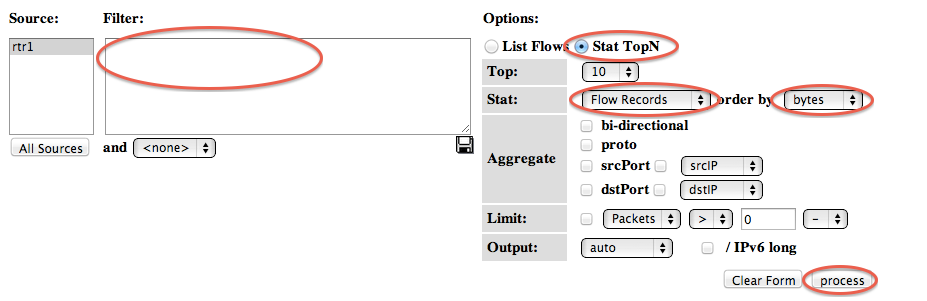
- The next thing we can do is to get NfSen to sort the flows by number of bytes. Remove any filter from the Filter box; select "Stat TopN", stat "Flow Records", order by "Bytes". Ensure all the aggregate boxes are all unchecked, then press process

- NFsen can show you inbound traffic grouped by receiver IP address. which means showing the total amount of traffic delivered to that host. To do this, Stat "DST IP Address", order by "bytes". Then apply a filter which shows only traffic to your group's network: "dst net 192.248.6.0/24". Yo ucan do the same with a single host.

- By clicking on an IP address, you will get some information from reverse DNS and whois.
Attachments (6)
- ns1.png (2.9 KB ) - added by 8 years ago.
- ns2.png (24.5 KB ) - added by 8 years ago.
- ns3.png (38.9 KB ) - added by 8 years ago.
- ns4.png (32.8 KB ) - added by 8 years ago.
- ns5.png (62.5 KB ) - added by 8 years ago.
- ns6.png (48.8 KB ) - added by 8 years ago.
Download all attachments as: .zip